

Question: The rectangles in the graph below illustrate a left - endpoint rectangles for f ( x ) = 1 3 x on the interval 4
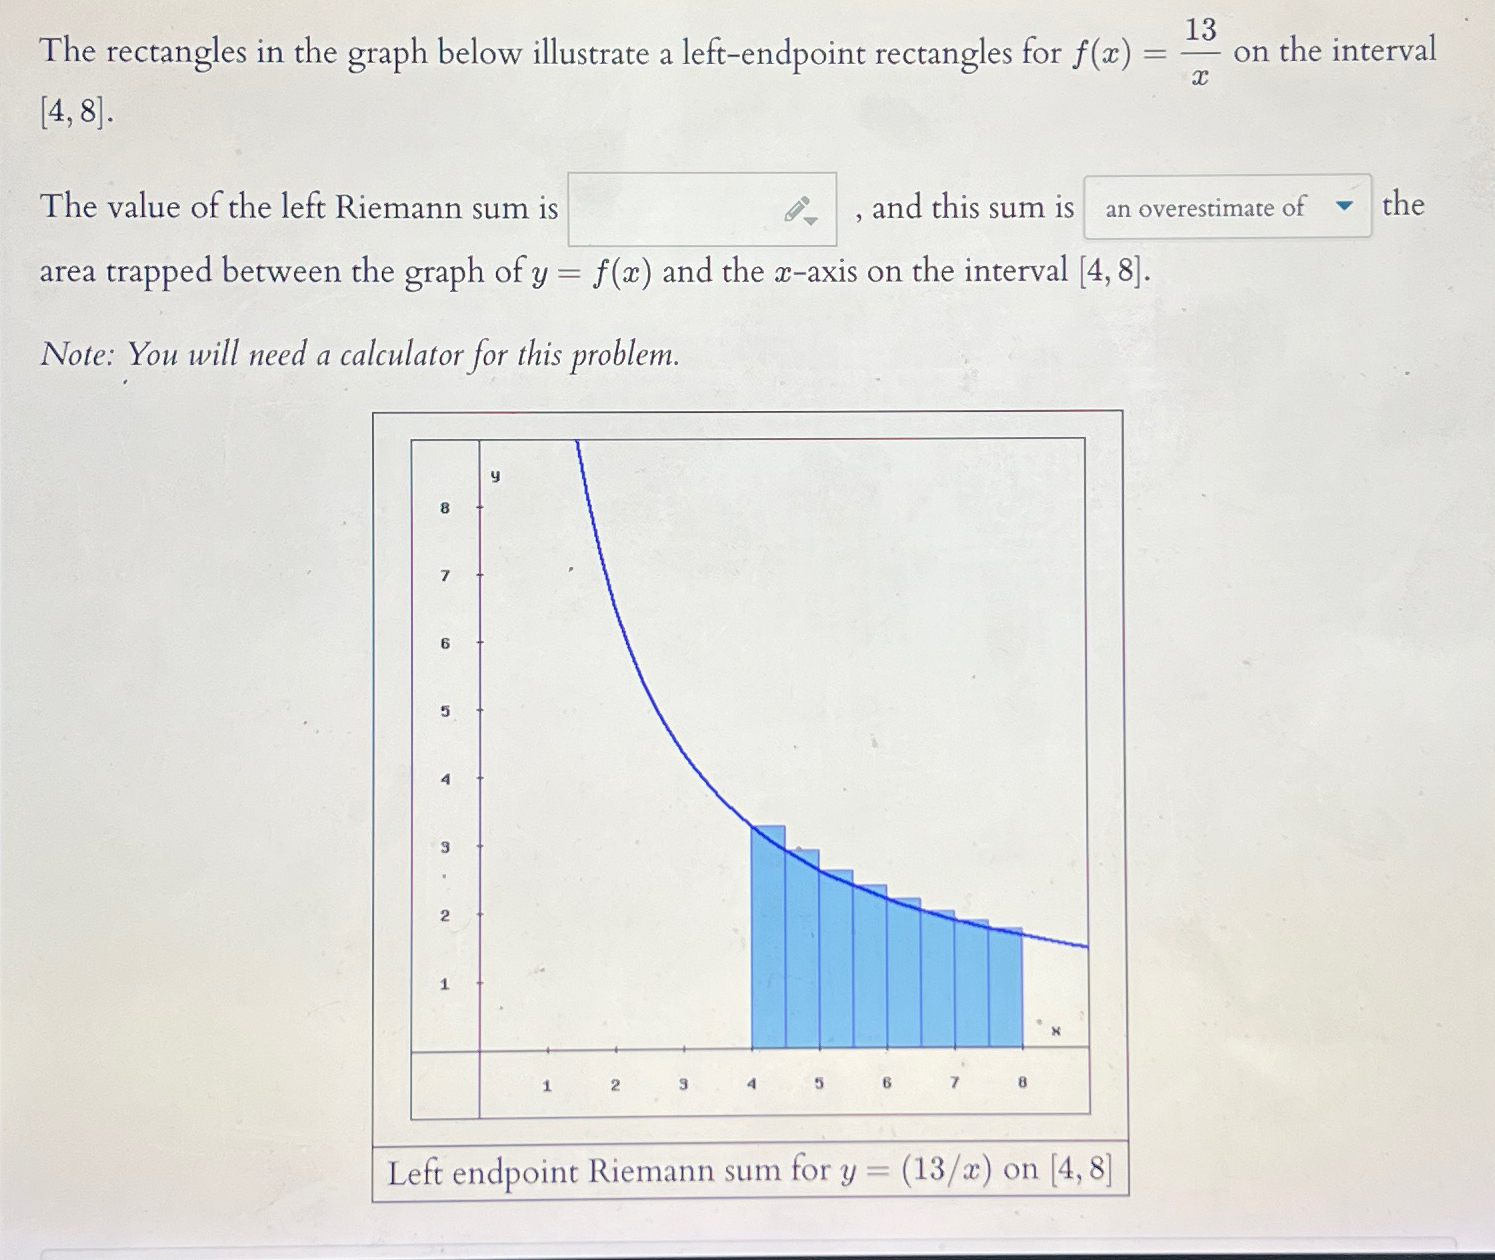
The rectangles in the graph below illustrate a leftendpoint rectangles for on the interval
The value of the left Riemann sum is and this sum is the area trapped between the graph of and the axis on the interval
Note: You will need a calculator for this problem.
Left endpoint Riemann sum for on
Step by Step Solution
There are 3 Steps involved in it
1 Expert Approved Answer
Step: 1 Unlock

Question Has Been Solved by an Expert!
Get step-by-step solutions from verified subject matter experts
Step: 2 Unlock
Step: 3 Unlock