

Question: The rectangles in the graph below illustrate a left endpoint Riemann sum for at) = (15 /ac) on the interval [2,6]. The value of this

![sum for at) = (15 /ac) on the interval [2,6]. The value](https://s3.amazonaws.com/si.experts.images/answers/2024/06/6679d10bef5b7_4036679d10bba498.jpg)
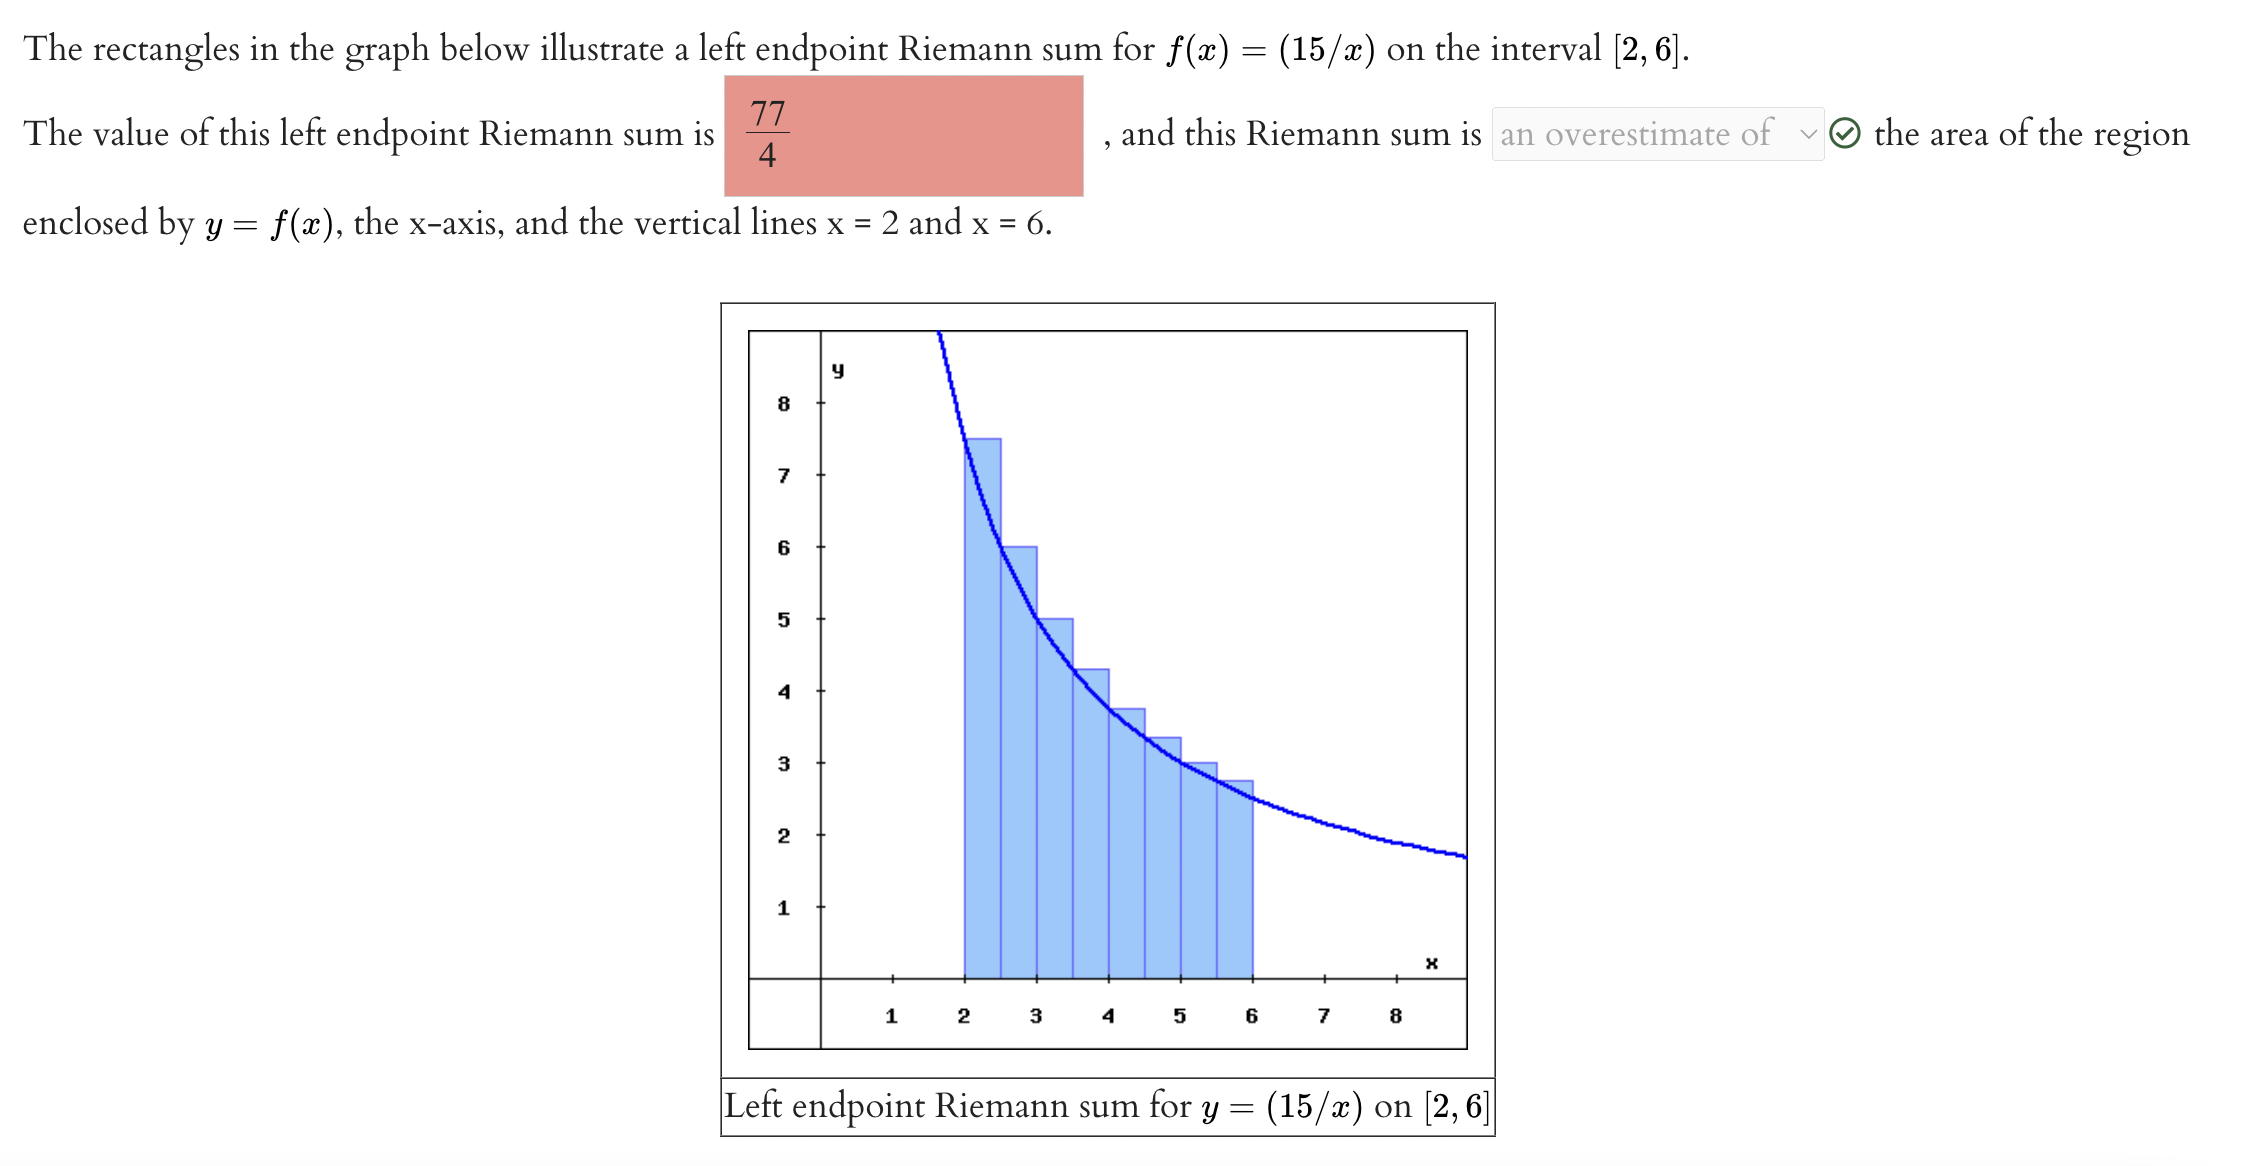
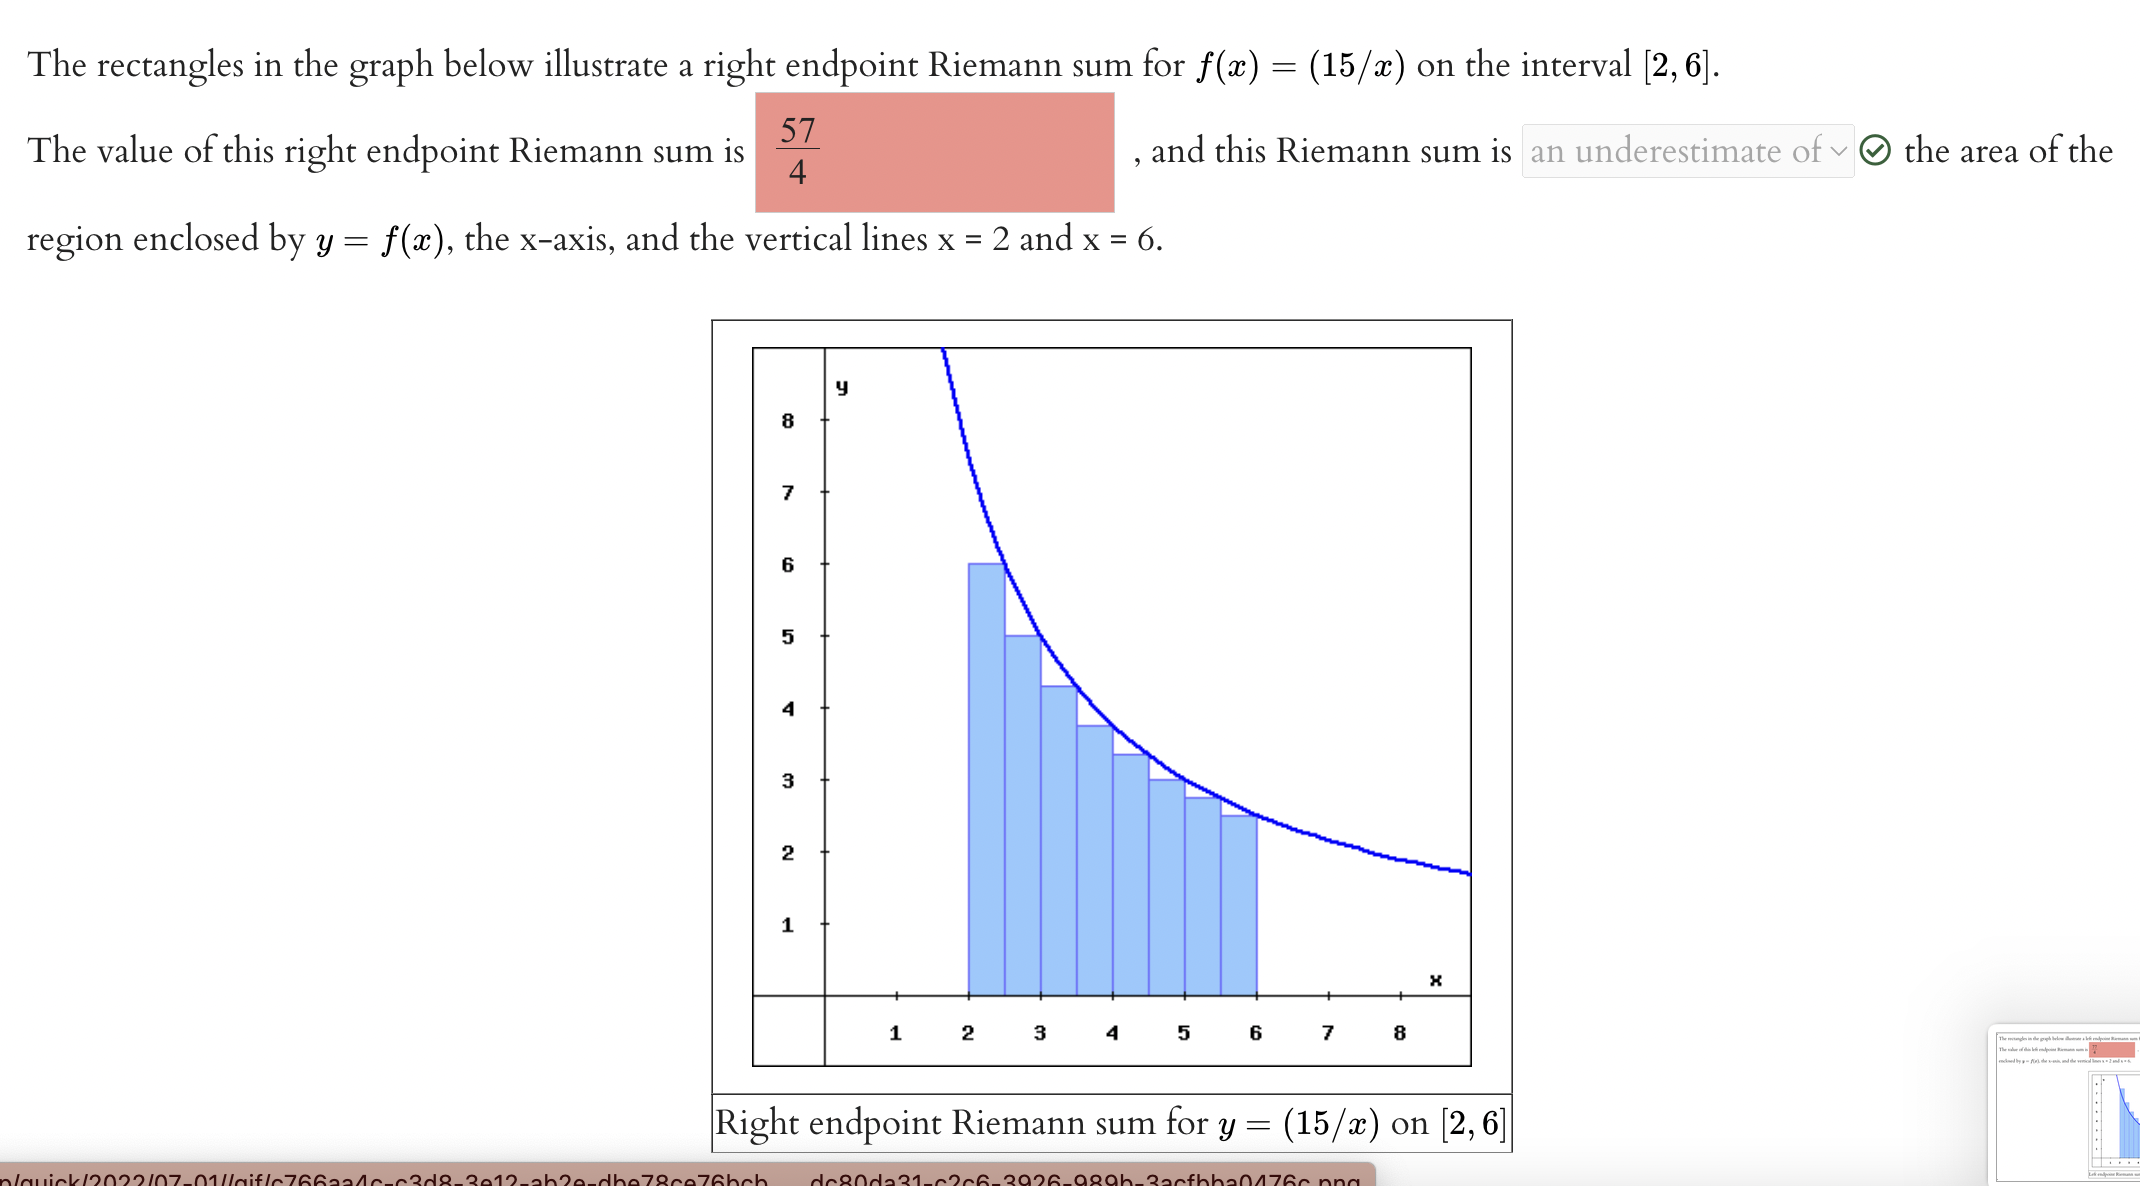

The rectangles in the graph below illustrate a left endpoint Riemann sum for at) = (15 /ac) on the interval [2,6]. The value of this left endpoint Riemann sum is - , and this Riemann sum is an overestimate of v Q) the area of the region enclosed by y = f(ac), the xaxis, and the vertical lines x = 2 and x = 6. Left endpoint Riemann sum for y = (15 /x) on [2, 6] The rectangles in the graph below illustrate a right endpoint Riemann sum for f (w) = (15 /ac) on the interval [2,6]. The value of this right endpoint Riemann sum is - , and this Riemann sum is an underestimate of v 9 the area of the region enclosed by y = f (.73), the Xaxis, and the vertical lines x = 2 and x = 6. Right endpoint Riemann sum for y = (15 / m) on [2,6] Ni _%= Consider the function f(x) = 6 - |x| defined on [-6, 6]. (a) Compute the left Riemann sum L4. L4 = (b) Compute the right Riemann sum R4. RA = (c) Compute the average value of L4 and R4. Average value (d) Compute the area under the graph of f. Area (e) Compare the two values found in (c) and (d). The average value is ? the area
Step by Step Solution
There are 3 Steps involved in it

Get step-by-step solutions from verified subject matter experts