

Question: The sample data below represent the number of late and on time flights for three airlines. Conduct the hypothesis test with a 0.05 level of
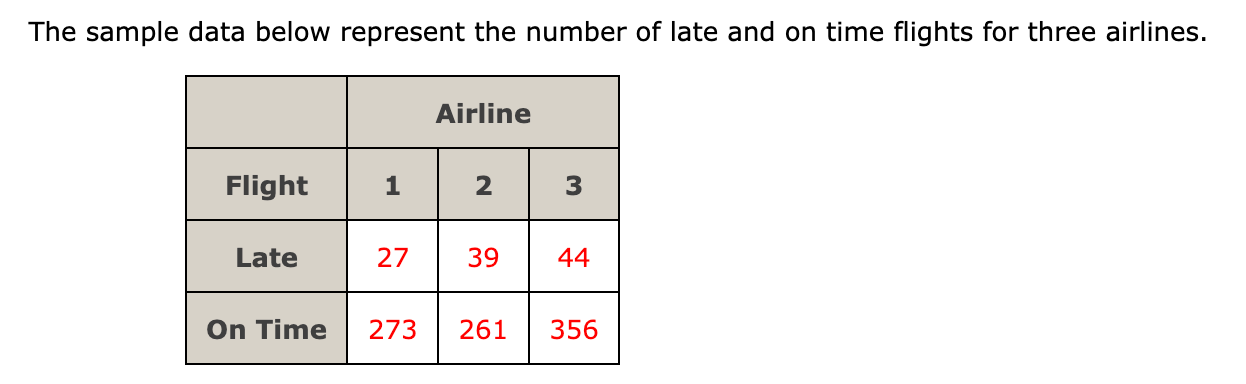
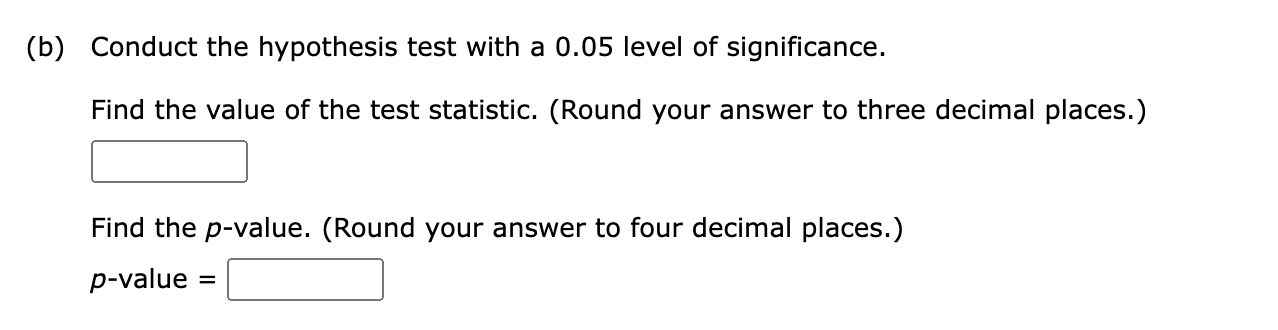
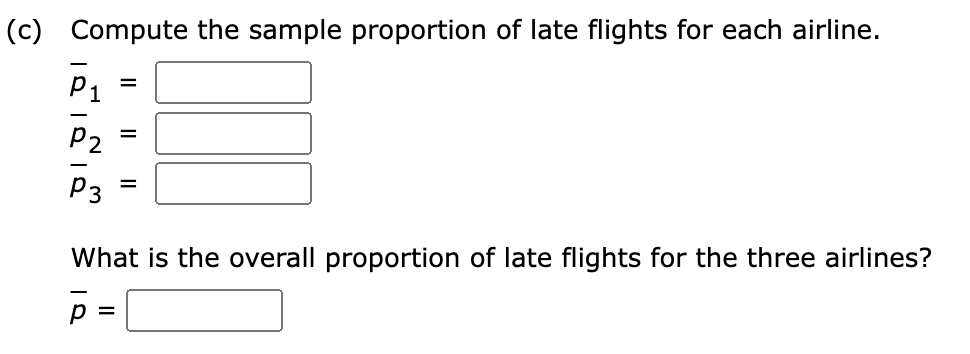
The sample data below represent the number of late and on time flights for three airlines. Conduct the hypothesis test with a 0.05 level of significance. Find the value of the test statistic. (Round your answer to three decimal places.) Find the p-value. (Round your answer to four decimal places.) p-value= Compute the sample proportion of late flights for each airline. p1=p2=p3= What is the overall proportion of late flights for the three airlines? p=
Step by Step Solution
There are 3 Steps involved in it
1 Expert Approved Answer
Step: 1 Unlock

Question Has Been Solved by an Expert!
Get step-by-step solutions from verified subject matter experts
Step: 2 Unlock
Step: 3 Unlock