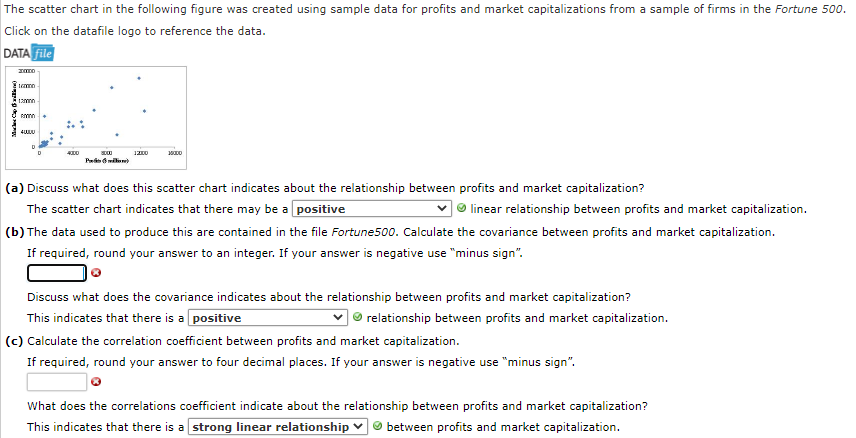
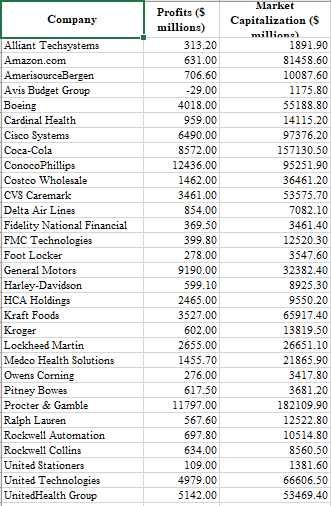
Question: The scatter chart in the following figure was created using sample data for profits and market capitalizations from a sample of firms in the Fortune

The scatter chart in the following figure wasThe scatter chart in the following figure was

The scatter chart in the following figure was created using sample data for profits and market capitalizations from a sample of firms in the Fortune 500. Click on the datafile logo to reference the data. DATA file RETRO 12 om D D 400 S000 2 (a) Discuss what does this scatter chart indicates about the relationship between profits and market capitalization? The scatter chart indicates that there may be a positive linear relationship between profits and market capitalization. (b) The data used to produce this are contained in the file Fortune 500. Calculate the covariance between profits and market capitalization. If required, round your answer to an integer. If your answer is negative use "minus sign. Discuss what does the covariance indicates about the relationship between profits and market capitalization? This indicates that there is a positive relationship between profits and market capitalization. (c) Calculate the correlation coefficient between profits and market capitalization. If required, round your answer to four decimal places. If your answer is negative use "minus sign". What does the correlations coefficient indicate about the relationship between profits and market capitalization? This indicates that there is a strong linear relationship between profits and market capitalization. Company Alliant Techsystems Amazon.com AmerisourceBergen Avis Budget Group Boeing Cardinal Health Cisco Systems Coca-Cola ConocoPhillips Costco Wholesale CVS Caremark Delta Air Lines Fidelity National Financial FMC Technologies Foot Locker General Motors Harley-Davidson HCA Holdings Kraft Foods Kroger Lockheed Martin Medco Health Solutions Owens Corning Pitney Bowes Procter & Gamble Ralph Lauren Rockwell Automation Rockwell Collins United Stationers United Technologies UnitedHealth Group Profits ($ millions) 313.20 631.00 706.60 -29.00 4018.00 959.00 6490.00 8572.00 12436.00 1462.00 3461.00 854.00 369.50 399.80 278.00 9190.00 599.10 2465.00 3527.00 602.00 2655.00 1455.70 276.00 617.50 11797.00 567.60 697.80 634.00 109.00 4979.00 5142.00 Market Capitalization ($ millione 1891.90 81458.60 10087.60 1175.80 55188.80 14115.20 97376.20 157130.50 95251.90 36461.20 53575.70 7082.10 3461.40 12520.30 3547.60 32382.40 8925.30 9550.20 65917.40 13819.50 26651.10 21865.90 3417.80 3681.20 182109.90 12522.80 10514.80 8560.50 1381.60 66606.50 53469.40

Step by Step Solution

There are 3 Steps involved in it

1 Expert Approved Answer
Step: 1 Unlock blur-text-image
Question Has Been Solved by an Expert!

Get step-by-step solutions from verified subject matter experts

Step: 2 Unlock
Step: 3 Unlock

Students Have Also Explored These Related General Management Questions!