

Question: The signal ( t ) shown below, is fed into a PCM system to obtain a digital representation for this signal. The signal ( t
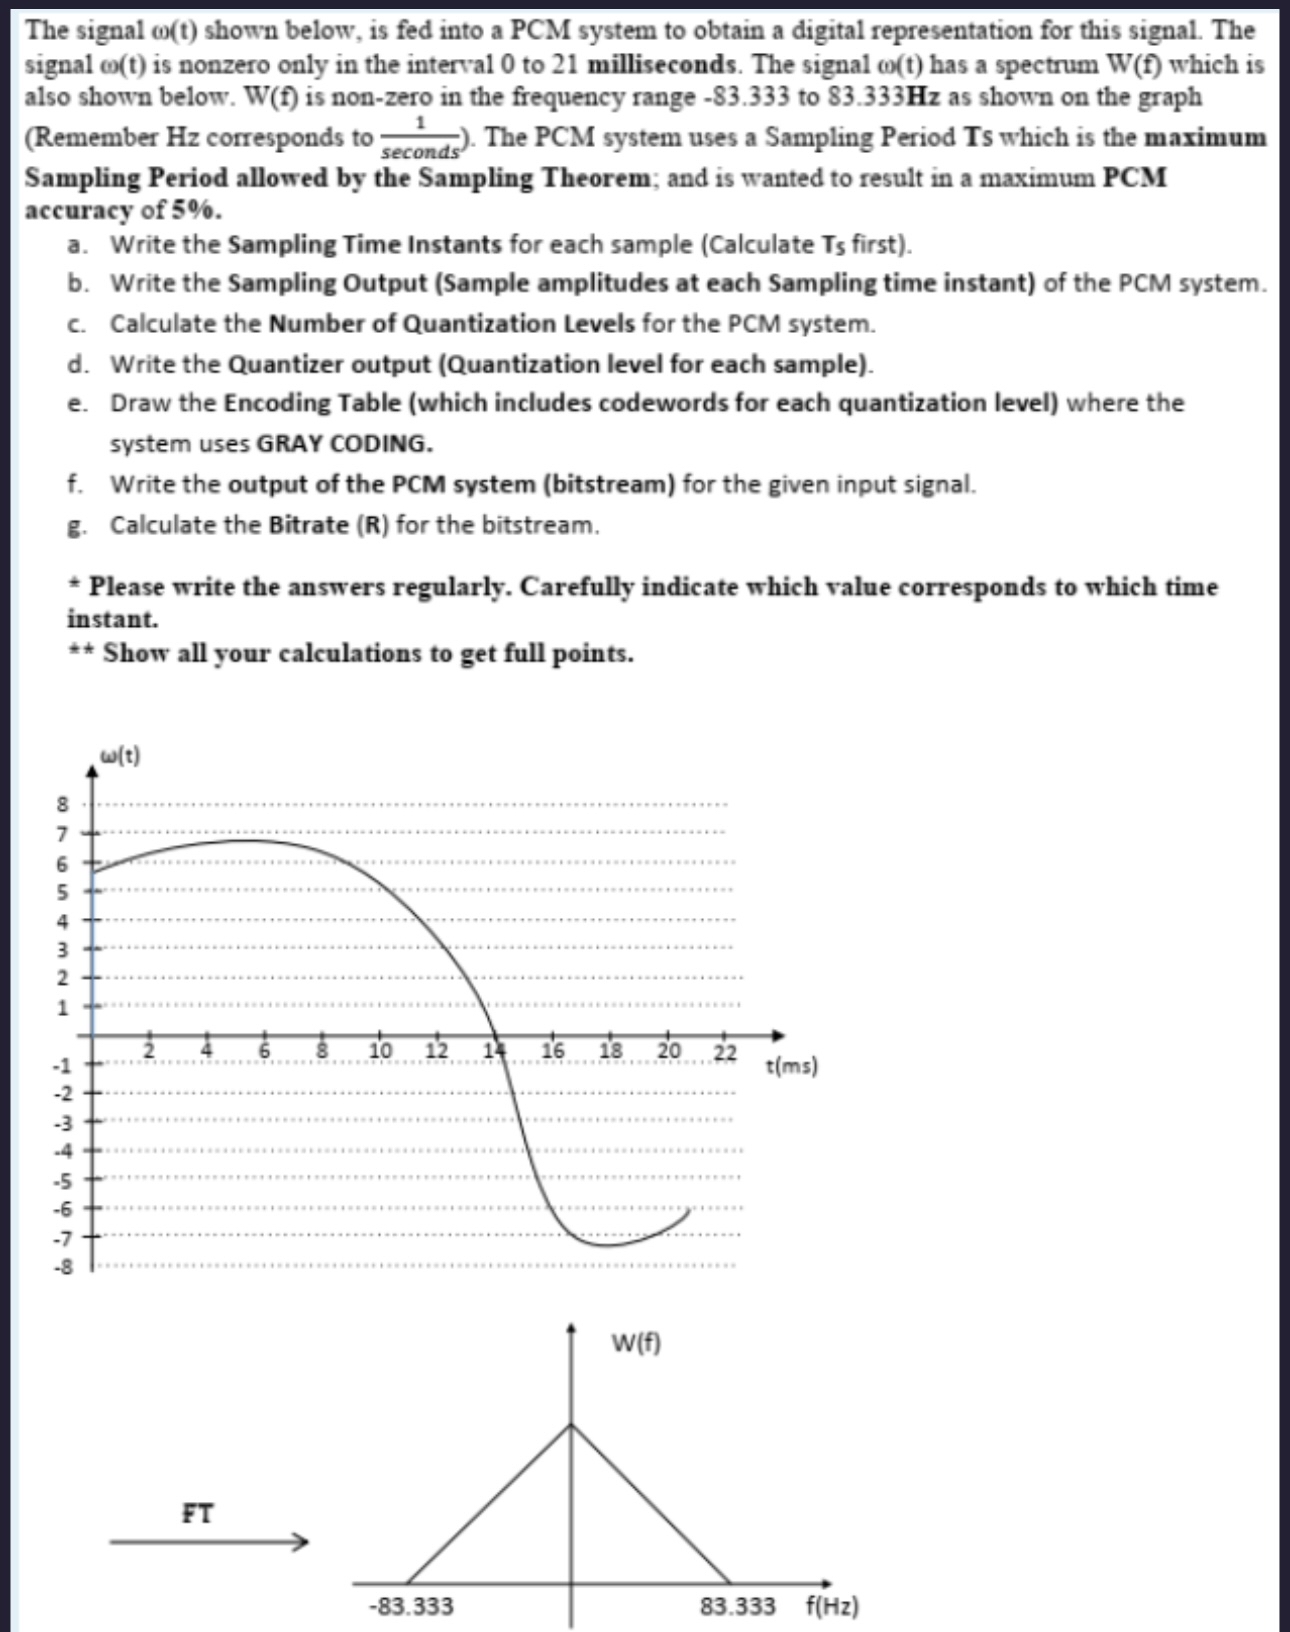
The signal shown below, is fed into a PCM system to obtain a digital representation for this signal. The signal is nonzero only in the interval to milliseconds. The signal has a spectrum which is also shown below. Wf is nonzero in the frequency range to Hz as shown on the graph Remember Hz corresponds to The PCM system uses a Sampling Period which is the maximum Sampling Period allowed by the Sampling Theorem; and is wanted to result in a maximum PCM accuracy of
a Write the Sampling Time Instants for each sample Calculate Ts first
b Write the Sampling Output Sample amplitudes at each Sampling time instant of the PCM system.
c Calculate the Number of Quantization Levels for the PCM system.
d Write the Quantizer output Quantization level for each sample
e Draw the Encoding Table which includes codewords for each quantization level where the system uses GRAY CODING.
f Write the output of the PCM system bitstream for the given input signal.
g Calculate the Bitrate R for the bitstream.
Please write the answers regularly. Carefully indicate which value corresponds to which time instant.
Show all your calculations to get full points.
Step by Step Solution
There are 3 Steps involved in it
1 Expert Approved Answer
Step: 1 Unlock

Question Has Been Solved by an Expert!
Get step-by-step solutions from verified subject matter experts
Step: 2 Unlock
Step: 3 Unlock