

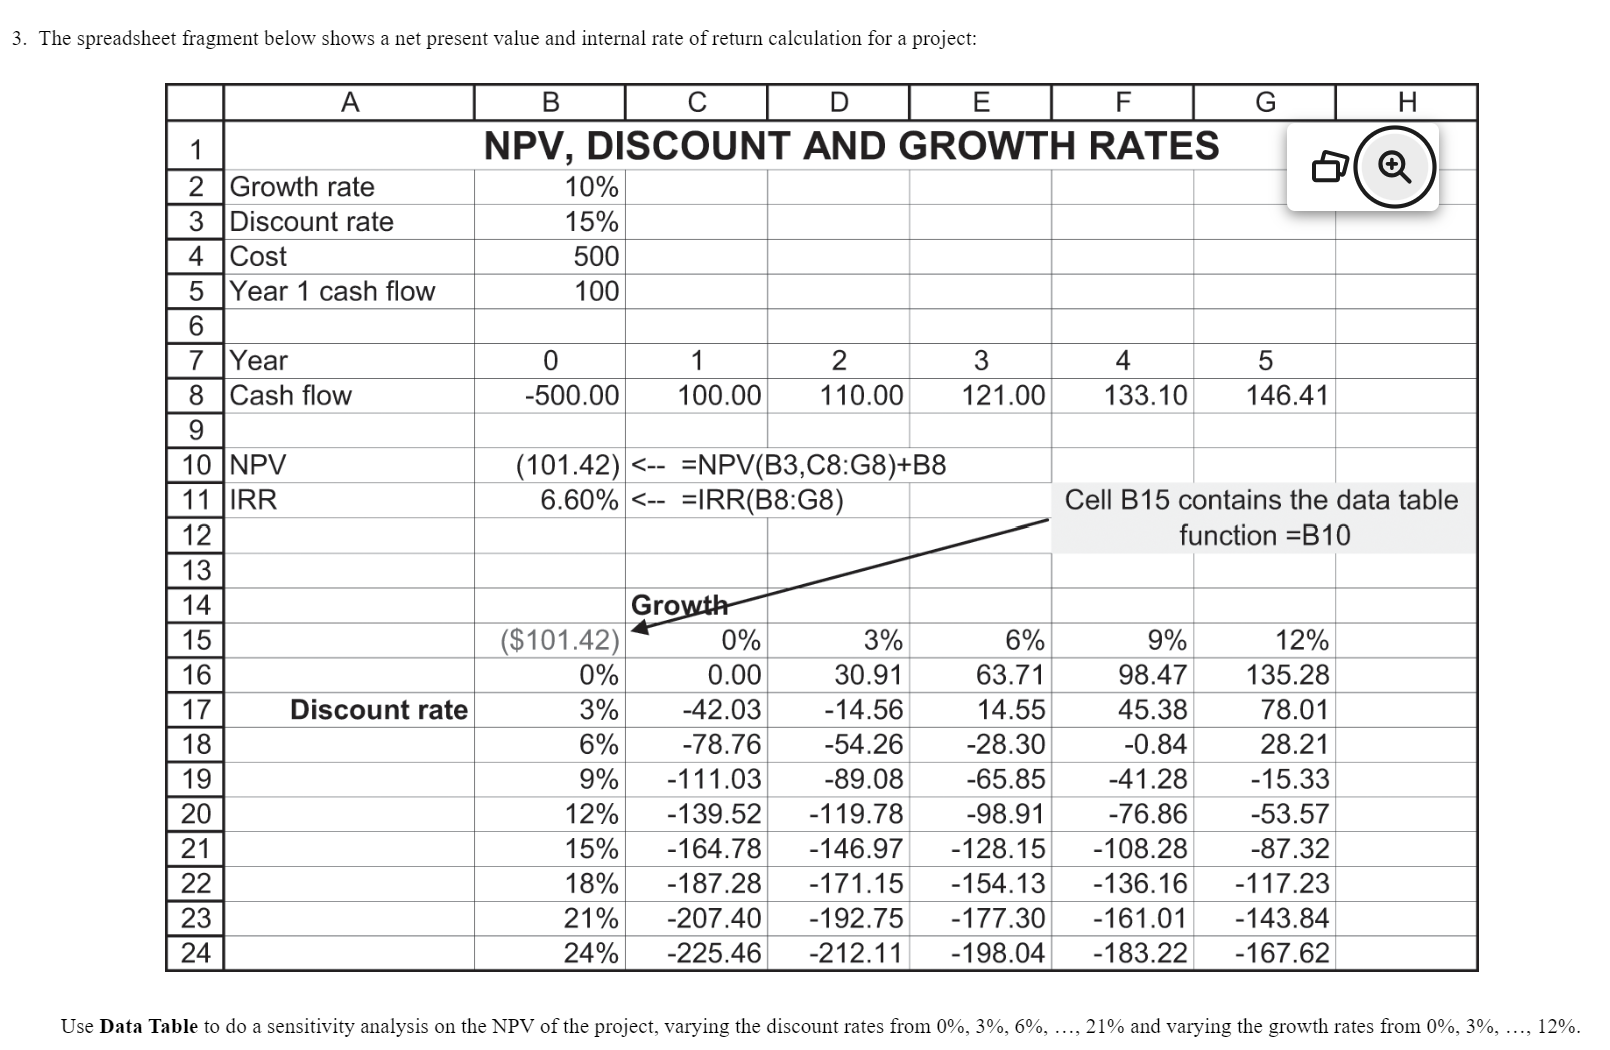
Question: The spreadsheet fragment below shows a net present value and internal rate of return calculation for a project: Use Data Table to do a sensitivity
The spreadsheet fragment below shows a net present value and internal rate of return calculation for a project:
Use Data Table to do a sensitivity analysis on the NPV of the project, varying the discount rates from dots, and varying the growth rates from dots, I need help with the NPV I am not sure what to do here. Please advise.
Step by Step Solution
There are 3 Steps involved in it
1 Expert Approved Answer
Step: 1 Unlock

Question Has Been Solved by an Expert!
Get step-by-step solutions from verified subject matter experts
Step: 2 Unlock
Step: 3 Unlock