

Question: The Student Commission on Programming and Entertainment (SCOPE) is preparing to host its first rock concert of the school year. To successfully produce this rock
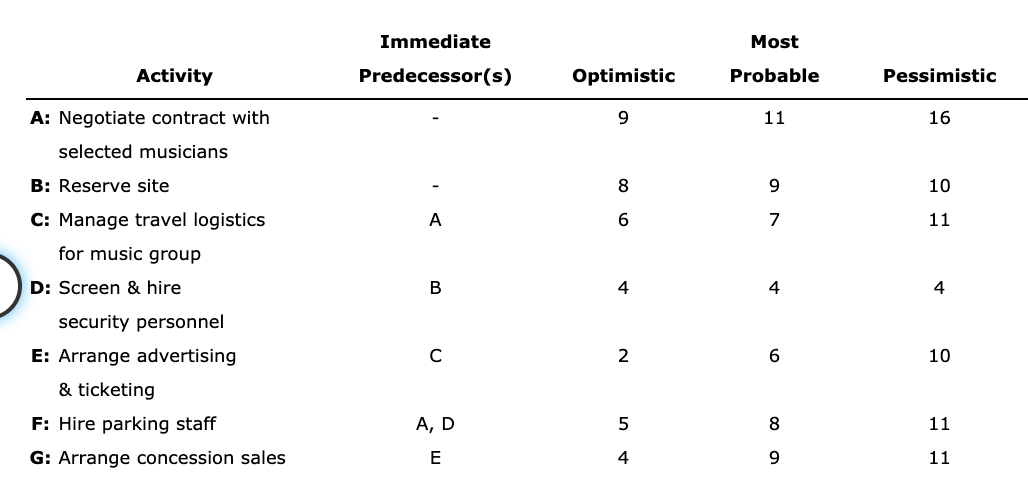
The Student Commission on Programming and Entertainment (SCOPE) is preparing to host its first rock concert of the school year. To successfully produce this rock concert, SCOPE has listed the requisite activities and related information in the following table(duration estimates
measured in days).
Notes: I am only stuck in the following sections: parts e, f, and g. Thank you.
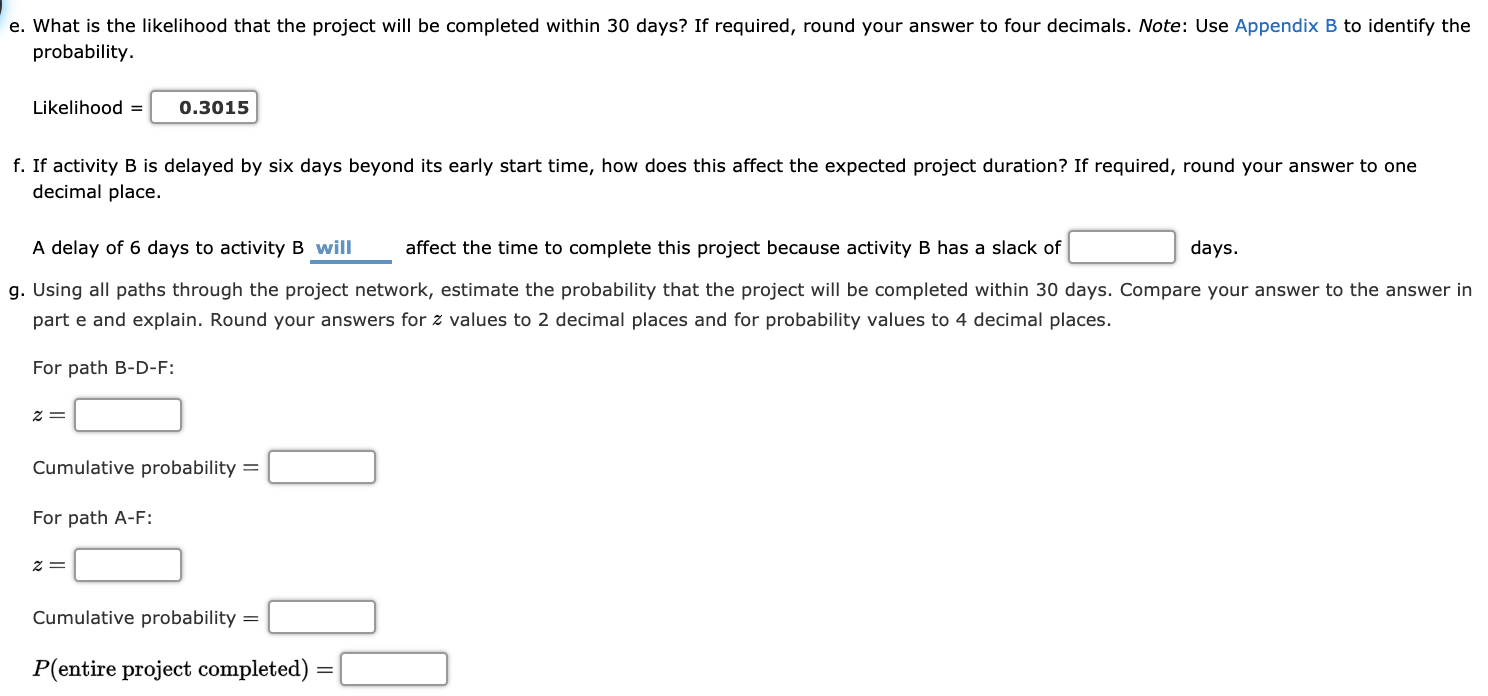
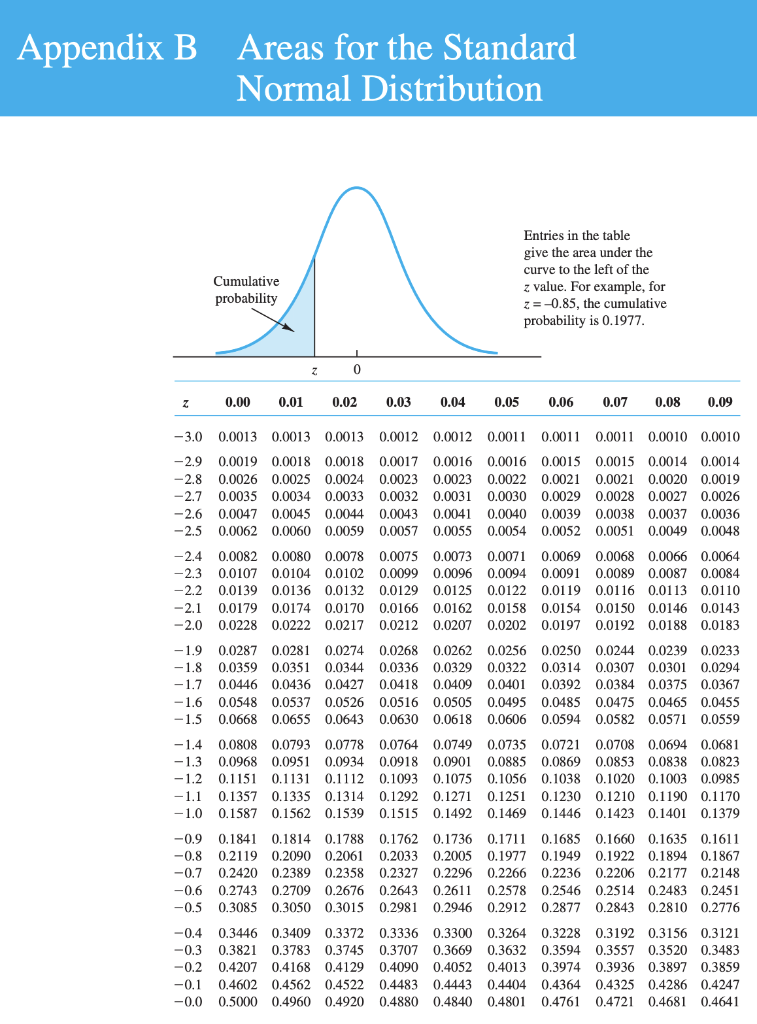
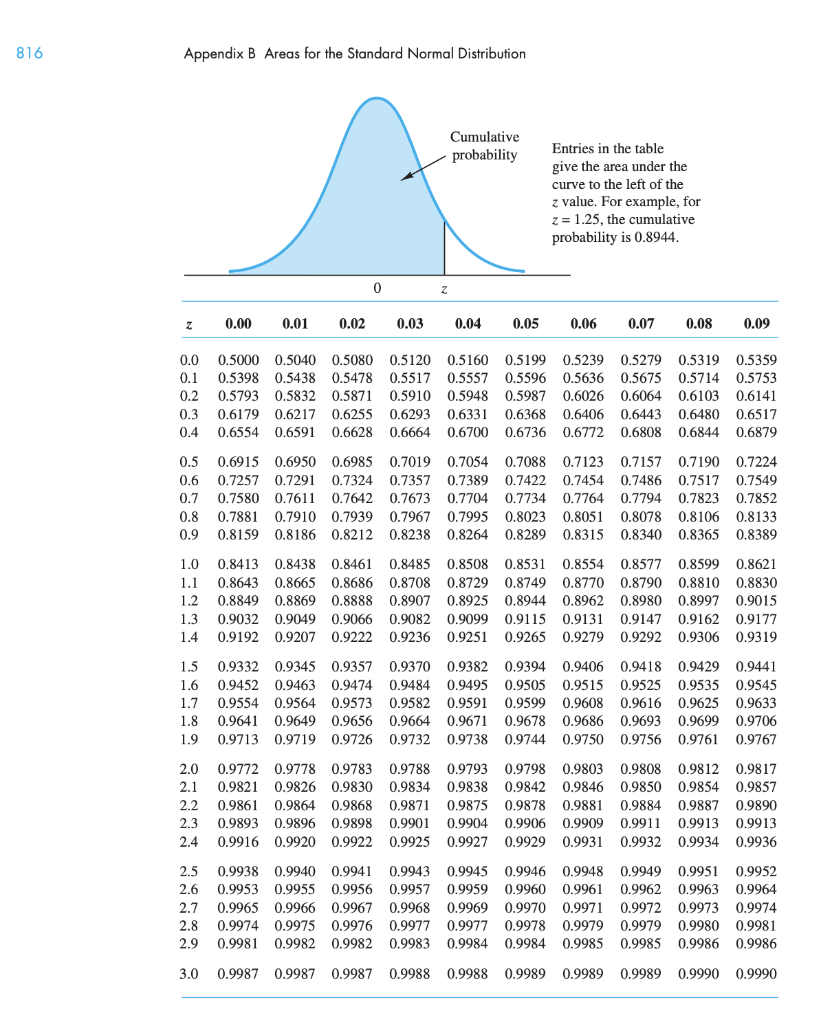
Most Immediate Predecessor(s) Activity Optimistic Probable Pessimistic A: Negotiate contract with selected musicians B: Reserve site c: Manage travel logistics for music group D: Screen & hire security personnel E: Arrange advertising & ticketing F: Hire parking staff G: Arrange concession sales e. What is the likelihood that the project will be completed within 30 days? If required, round your answer to four decimals. Note: Use Appendix B to identify the probability. Likelihood = 0.3015 f. If activity B is delayed by six days beyond its early start time, how does this affect the expected project duration? If required, round your answer to one decimal place. A delay of 6 days to activity B will affect the time to complete this project because activity B has a slack of days. g. Using all paths through the project network, estimate the probability that the project will be completed within 30 days. Compare your answer to the answer in part e and explain. Round your answers for z values to 2 decimal places and for probability values to 4 decimal places. For path B-D-F: z= stability = Cumulative probability = For path A-F: z=1 Cumulative probability = P(entire project completed) = Appendix B Areas for the Standard Normal Distribution Cumulative probability Entries in the table give the area under the curve to the left of the z value. For example, for z= -0.85, the cumulative probability is 0.1977. 2 0 z 0.00 0.01 0.02 0.03 0.04 0.05 0.06 0.07 0.08 0.09 -3.0 -2.9 -2.8 -2.7 -2.6 -2.5 -2.4 -2.3 -2.2 -2.1 -2.0 -1.9 -1.8 -1.7 -1.6 -1.5 0.0013 0.0013 0.0013 0.0012 0.0012 0.0011 0.0011 0.0011 0.0010 0.0010 0.0019 0.0018 0.0018 0.0017 0.0016 0.0016 0.0015 0.0015 0.0014 0.0014 0.0026 0.0025 0.0024 0.0023 0.0023 0.0022 0.0021 0.0021 0.0020 0.0019 0.0035 0.0034 0.0033 0.0032 0.0031 0.0030 0.0029 0.0028 0.0027 0.0026 0.0047 0.0045 0.0044 0.0043 0.0041 0.0040 0.0039 0.0038 0.0037 0.0036 0.0062 0.0060 0.0059 0.0057 0.0055 0.0054 0.0052 0.0051 0.0049 0.0048 0.0082 0.0080 0.0078 0.0075 0.0073 0.0071 0.0069 0.0068 0.0066 0.0064 0.0107 0.0104 0.0102 0.0099 0.0096 0.0094 0.0091 0.0089 0.0087 0.0084 0.0139 0.0136 0.0132 0.0129 0.0125 0.0122 0.0119 0.0116 0.0113 0.0110 0.0179 0.0174 0.0170 0.0166 0.0162 0.0158 0.0154 0.0150 0.0146 0.0143 0.0228 0.0222 0.0217 0.0212 0.0207 0.0202 0.0197 0.0192 0.0188 0.0183 0.0287 0.0281 0.0274 0.0268 0.0262 0.0256 0.0250 0.0244 0.0239 0.0233 0.0359 0.0351 0.0344 0.0336 0.0329 0.0322 0.0314 0.0307 0.0301 0.0294 0.0446 0.0436 0.0427 0.0418 0.0409 0.0401 0.0392 0.0384 0.0375 0.0367 0.0548 0.0537 0.0526 0.0516 0.0505 0.0495 0.0485 0.0475 0.0465 0.0455 0.0668 0.0655 0.0643 0.0630 0.0618 0.0606 0.0594 0.0582 0.0571 0.0559 -1.4 -1.3 -1.2 -1.1 -1.0 0.0808 0.0793 0.0778 0.0968 0.0951 0.0934 0.1151 0.1131 0.1112 0.1357 0.1335 0.1314 0.1587 0.1562 0.1539 0.0764 0.0749 0.0735 0.0721 0.0708 0.0694 0.0681 0.0918 0.0901 0.0885 0.0869 0.0853 0.0838 0.0823 0.1093 0.1075 0.1056 0.1038 0.1020 0.1003 0.0985 0.1292 0.1271 0.1251 0.1230 0.1210 0.1190 0.1170 0.1515 0.1492 0.1469 0.1446 0.1423 0.1401 0.1379 -0.9 -0.8 -0.7 -0.6 -0.5 0.1841 0.1814 0.1788 0.2119 0.2090 0.2061 0.2420 0.2389 0.2358 0.2743 0.2709 0.2676 0.3085 0.3050 0.3015 0.1762 0.1736 0.1711 0.2033 0.2005 0.1977 0.2327 0.2296 0.2266 0.2643 0.2611 0.2578 0.2981 0.2946 0.2912 0.1685 0.1949 0.2236 0.2546 0.2877 0.1660 0.1922 0.2206 0.2514 0.2843 0.1635 0.1611 0.1894 0.1867 0.2177 0.2148 0.2483 0.2451 0.2810 0.2776 -0.4 0.3446 0.3409 0.3372 0.3336 0.3300 0.3264 0.3228 0.3192 0.3156 0.3121 -0.3 0.3821 0.3783 0.3745 0.3707 0.3669 0.3632 0.3594 0.3557 0.3520 0.3483 -0.2 0.4207 0.4168 0.4129 0.4090 0.4052 0.4013 0.3974 0.3936 0.3897 0.3859 -0.1 0.4602 0.4562 0.4522 0.4483 0.4443 0.4404 0.4364 0.4325 0.4286 0.4247 -0.0 0.5000 0.4960 0.4920 0.4880 0.4840 0.4801 0.4761 0.4721 0.4681 0.4641 816 Appendix B Areas for the Standard Normal Distribution Cumulative probability Entries in the table give the area under the curve to the left of the z value. For example, for z= 1.25, the cumulative probability is 0.8944. z 0.00 0.01 0.02 0.03 0.04 0.05 0.06 0.07 0.08 0.09 0.0 0.1 0.2 0.3 0.4 0.5000 0.5040 0.5080 0.5120 0.5160 0.5199 0.5398 0.5438 0.5478 0.5517 0.5557 0.5596 0.5793 0.5832 0.5871 0.5910 0.5948 0.5987 0.6179 0.6217 0.6255 0.6293 0.6331 0.6368 0.6554 0.6591 0.6628 0.6664 0.6700 0.6736 0.5239 0.5279 0.5319 0.5359 0.5636 0.5675 0.5714 0.5753 0.6026 0.6064 0.6103 0.6141 0.6406 0.6443 0.6480 0.6517 0.6772 0.6808 0.6844 0.6879 0.5 0.6 0.7 0.8 0.9 0.6915 0.7257 0.7580 0.7881 0.8159 0.6950 0.7291 0.7611 0.7910 0.8186 0.6985 0.7324 0.7642 0.7939 0.8212 0.7019 0.7357 0.7673 0.7967 0.8238 0.7054 0.7389 0.7704 0.7995 0.8264 0.7088 0.7422 0.7734 0.8023 0.8289 0.7123 0.7454 0.7764 0.8051 0.8315 0.7157 0.7486 0.7794 0.8078 0.8340 0.7190 0.7517 0.7823 0.8106 0.8365 0.7224 0.7549 0.7852 0.8133 0.8389 1.0 1.1 1.2 1.3 1.4 0.8599 0.8810 0.8997 0.9162 0.9306 0.8621 0.8830 0.9015 0.9177 0.9319 0.8413 0.8438 0.8461 0.8643 0.8665 0.8686 0.8849 0.8869 0.8888 0.9032 0.9049 0.9066 0.9192 0.9207 0.9222 0.9332 0.9345 0.9357 0.9452 0.9463 0.9474 0.9554 0.9564 0.9573 0.9641 0.9649 0.9656 0.9713 0.9719 0.9726 0.8485 0.8508 0.8531 0.8554 0.8577 0.8708 0.8729 0.8749 0.8770 0.8790 0.8907 0.8925 0.8944 0.8962 0.8980 0.9082 0.9099 0.9115 0.9131 0.9147 0.9236 0.9251 0.9265 0.9279 0.9292 0.9370 0.9382 0.9394 0.9406 0.9418 0.9484 0.9495 0.9505 0.9515 0.9525 0.9582 0.9591 0.9599 0.9608 0.9616 0.9664 0.9671 0.9678 0.9686 0.9693 0.9732 0.9738 0.9744 0.9750 0.9756 1.5 1.6 1.7 1.8 1.9 0.9429 0.9441 0.9535 0.9545 0.9625 0.9633 0.9699 0.9706 0.9761 0.9767 2.0 2.1 2.2 2.3 2.4 0.9772 0.9778 0.9821 0.9826 0.9861 0.9864 0.9893 0.9896 0.9916 0.9920 0.9783 0.9788 0.9793 0.9830 0.9834 0.9838 0.9868 0.9871 0.9875 0.9898 0.9901 0.9904 0.9922 0.9925 0.9927 0.9798 0.9842 0.9878 0.9906 0.9929 0.98030.9808 0.9846 0.9850 0.9881 0.9884 0.9909 0.9911 0.9931 0.9932 0.9812 0.9854 0.9887 0.9913 0.9934 0.9817 0.9857 0.9890 0.9913 0.9936 2.5 2.6 2.7 2.8 2.9 0.9938 0.9940 0.9941 0.9953 0.9955 0.9956 0.9965 0.9966 0.9967 0.9974 0.9975 0.9976 0.9981 0.9982 0.9982 0.9943 0.9957 0.9968 0.9977 0.9983 0.9945 0.9959 0.9969 0.9977 0.9984 0.9946 0.9960 0.9970 0.9978 0.9984 0.9948 0.9961 0.9971 0.9979 0.9985 0.9949 0.9962 0.9972 0.9979 0.9985 0.9951 0.9952 0.9963 0.9964 0.9973 0.9974 0.9980 0.9981 0.9986 0.9986 3.0 0.9987 0.9987 0.9987 0.9988 0.9988 0.9989 0.9989 0.9989 0.9990 0.9990 Most Immediate Predecessor(s) Activity Optimistic Probable Pessimistic A: Negotiate contract with selected musicians B: Reserve site c: Manage travel logistics for music group D: Screen & hire security personnel E: Arrange advertising & ticketing F: Hire parking staff G: Arrange concession sales e. What is the likelihood that the project will be completed within 30 days? If required, round your answer to four decimals. Note: Use Appendix B to identify the probability. Likelihood = 0.3015 f. If activity B is delayed by six days beyond its early start time, how does this affect the expected project duration? If required, round your answer to one decimal place. A delay of 6 days to activity B will affect the time to complete this project because activity B has a slack of days. g. Using all paths through the project network, estimate the probability that the project will be completed within 30 days. Compare your answer to the answer in part e and explain. Round your answers for z values to 2 decimal places and for probability values to 4 decimal places. For path B-D-F: z= stability = Cumulative probability = For path A-F: z=1 Cumulative probability = P(entire project completed) = Appendix B Areas for the Standard Normal Distribution Cumulative probability Entries in the table give the area under the curve to the left of the z value. For example, for z= -0.85, the cumulative probability is 0.1977. 2 0 z 0.00 0.01 0.02 0.03 0.04 0.05 0.06 0.07 0.08 0.09 -3.0 -2.9 -2.8 -2.7 -2.6 -2.5 -2.4 -2.3 -2.2 -2.1 -2.0 -1.9 -1.8 -1.7 -1.6 -1.5 0.0013 0.0013 0.0013 0.0012 0.0012 0.0011 0.0011 0.0011 0.0010 0.0010 0.0019 0.0018 0.0018 0.0017 0.0016 0.0016 0.0015 0.0015 0.0014 0.0014 0.0026 0.0025 0.0024 0.0023 0.0023 0.0022 0.0021 0.0021 0.0020 0.0019 0.0035 0.0034 0.0033 0.0032 0.0031 0.0030 0.0029 0.0028 0.0027 0.0026 0.0047 0.0045 0.0044 0.0043 0.0041 0.0040 0.0039 0.0038 0.0037 0.0036 0.0062 0.0060 0.0059 0.0057 0.0055 0.0054 0.0052 0.0051 0.0049 0.0048 0.0082 0.0080 0.0078 0.0075 0.0073 0.0071 0.0069 0.0068 0.0066 0.0064 0.0107 0.0104 0.0102 0.0099 0.0096 0.0094 0.0091 0.0089 0.0087 0.0084 0.0139 0.0136 0.0132 0.0129 0.0125 0.0122 0.0119 0.0116 0.0113 0.0110 0.0179 0.0174 0.0170 0.0166 0.0162 0.0158 0.0154 0.0150 0.0146 0.0143 0.0228 0.0222 0.0217 0.0212 0.0207 0.0202 0.0197 0.0192 0.0188 0.0183 0.0287 0.0281 0.0274 0.0268 0.0262 0.0256 0.0250 0.0244 0.0239 0.0233 0.0359 0.0351 0.0344 0.0336 0.0329 0.0322 0.0314 0.0307 0.0301 0.0294 0.0446 0.0436 0.0427 0.0418 0.0409 0.0401 0.0392 0.0384 0.0375 0.0367 0.0548 0.0537 0.0526 0.0516 0.0505 0.0495 0.0485 0.0475 0.0465 0.0455 0.0668 0.0655 0.0643 0.0630 0.0618 0.0606 0.0594 0.0582 0.0571 0.0559 -1.4 -1.3 -1.2 -1.1 -1.0 0.0808 0.0793 0.0778 0.0968 0.0951 0.0934 0.1151 0.1131 0.1112 0.1357 0.1335 0.1314 0.1587 0.1562 0.1539 0.0764 0.0749 0.0735 0.0721 0.0708 0.0694 0.0681 0.0918 0.0901 0.0885 0.0869 0.0853 0.0838 0.0823 0.1093 0.1075 0.1056 0.1038 0.1020 0.1003 0.0985 0.1292 0.1271 0.1251 0.1230 0.1210 0.1190 0.1170 0.1515 0.1492 0.1469 0.1446 0.1423 0.1401 0.1379 -0.9 -0.8 -0.7 -0.6 -0.5 0.1841 0.1814 0.1788 0.2119 0.2090 0.2061 0.2420 0.2389 0.2358 0.2743 0.2709 0.2676 0.3085 0.3050 0.3015 0.1762 0.1736 0.1711 0.2033 0.2005 0.1977 0.2327 0.2296 0.2266 0.2643 0.2611 0.2578 0.2981 0.2946 0.2912 0.1685 0.1949 0.2236 0.2546 0.2877 0.1660 0.1922 0.2206 0.2514 0.2843 0.1635 0.1611 0.1894 0.1867 0.2177 0.2148 0.2483 0.2451 0.2810 0.2776 -0.4 0.3446 0.3409 0.3372 0.3336 0.3300 0.3264 0.3228 0.3192 0.3156 0.3121 -0.3 0.3821 0.3783 0.3745 0.3707 0.3669 0.3632 0.3594 0.3557 0.3520 0.3483 -0.2 0.4207 0.4168 0.4129 0.4090 0.4052 0.4013 0.3974 0.3936 0.3897 0.3859 -0.1 0.4602 0.4562 0.4522 0.4483 0.4443 0.4404 0.4364 0.4325 0.4286 0.4247 -0.0 0.5000 0.4960 0.4920 0.4880 0.4840 0.4801 0.4761 0.4721 0.4681 0.4641 816 Appendix B Areas for the Standard Normal Distribution Cumulative probability Entries in the table give the area under the curve to the left of the z value. For example, for z= 1.25, the cumulative probability is 0.8944. z 0.00 0.01 0.02 0.03 0.04 0.05 0.06 0.07 0.08 0.09 0.0 0.1 0.2 0.3 0.4 0.5000 0.5040 0.5080 0.5120 0.5160 0.5199 0.5398 0.5438 0.5478 0.5517 0.5557 0.5596 0.5793 0.5832 0.5871 0.5910 0.5948 0.5987 0.6179 0.6217 0.6255 0.6293 0.6331 0.6368 0.6554 0.6591 0.6628 0.6664 0.6700 0.6736 0.5239 0.5279 0.5319 0.5359 0.5636 0.5675 0.5714 0.5753 0.6026 0.6064 0.6103 0.6141 0.6406 0.6443 0.6480 0.6517 0.6772 0.6808 0.6844 0.6879 0.5 0.6 0.7 0.8 0.9 0.6915 0.7257 0.7580 0.7881 0.8159 0.6950 0.7291 0.7611 0.7910 0.8186 0.6985 0.7324 0.7642 0.7939 0.8212 0.7019 0.7357 0.7673 0.7967 0.8238 0.7054 0.7389 0.7704 0.7995 0.8264 0.7088 0.7422 0.7734 0.8023 0.8289 0.7123 0.7454 0.7764 0.8051 0.8315 0.7157 0.7486 0.7794 0.8078 0.8340 0.7190 0.7517 0.7823 0.8106 0.8365 0.7224 0.7549 0.7852 0.8133 0.8389 1.0 1.1 1.2 1.3 1.4 0.8599 0.8810 0.8997 0.9162 0.9306 0.8621 0.8830 0.9015 0.9177 0.9319 0.8413 0.8438 0.8461 0.8643 0.8665 0.8686 0.8849 0.8869 0.8888 0.9032 0.9049 0.9066 0.9192 0.9207 0.9222 0.9332 0.9345 0.9357 0.9452 0.9463 0.9474 0.9554 0.9564 0.9573 0.9641 0.9649 0.9656 0.9713 0.9719 0.9726 0.8485 0.8508 0.8531 0.8554 0.8577 0.8708 0.8729 0.8749 0.8770 0.8790 0.8907 0.8925 0.8944 0.8962 0.8980 0.9082 0.9099 0.9115 0.9131 0.9147 0.9236 0.9251 0.9265 0.9279 0.9292 0.9370 0.9382 0.9394 0.9406 0.9418 0.9484 0.9495 0.9505 0.9515 0.9525 0.9582 0.9591 0.9599 0.9608 0.9616 0.9664 0.9671 0.9678 0.9686 0.9693 0.9732 0.9738 0.9744 0.9750 0.9756 1.5 1.6 1.7 1.8 1.9 0.9429 0.9441 0.9535 0.9545 0.9625 0.9633 0.9699 0.9706 0.9761 0.9767 2.0 2.1 2.2 2.3 2.4 0.9772 0.9778 0.9821 0.9826 0.9861 0.9864 0.9893 0.9896 0.9916 0.9920 0.9783 0.9788 0.9793 0.9830 0.9834 0.9838 0.9868 0.9871 0.9875 0.9898 0.9901 0.9904 0.9922 0.9925 0.9927 0.9798 0.9842 0.9878 0.9906 0.9929 0.98030.9808 0.9846 0.9850 0.9881 0.9884 0.9909 0.9911 0.9931 0.9932 0.9812 0.9854 0.9887 0.9913 0.9934 0.9817 0.9857 0.9890 0.9913 0.9936 2.5 2.6 2.7 2.8 2.9 0.9938 0.9940 0.9941 0.9953 0.9955 0.9956 0.9965 0.9966 0.9967 0.9974 0.9975 0.9976 0.9981 0.9982 0.9982 0.9943 0.9957 0.9968 0.9977 0.9983 0.9945 0.9959 0.9969 0.9977 0.9984 0.9946 0.9960 0.9970 0.9978 0.9984 0.9948 0.9961 0.9971 0.9979 0.9985 0.9949 0.9962 0.9972 0.9979 0.9985 0.9951 0.9952 0.9963 0.9964 0.9973 0.9974 0.9980 0.9981 0.9986 0.9986 3.0 0.9987 0.9987 0.9987 0.9988 0.9988 0.9989 0.9989 0.9989 0.9990 0.9990Step by Step Solution
There are 3 Steps involved in it
1 Expert Approved Answer
Step: 1 Unlock

Question Has Been Solved by an Expert!
Get step-by-step solutions from verified subject matter experts
Step: 2 Unlock
Step: 3 Unlock