

The table and graph below show the numbers of the products according to the scores given by
Fantastic news! We've Found the answer you've been seeking!
Question:
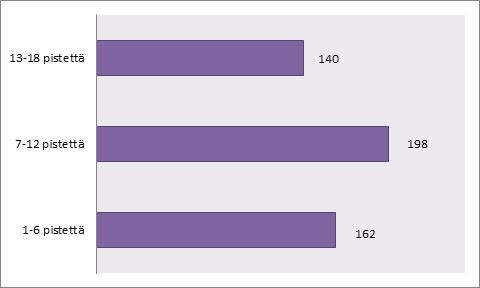
The table and graph below show the numbers of the products according to the scores given by the customers. First, calculate the average score from the raw material of the table, assuming an even distribution within the categories; for example, in classes 1-3, all three scores are equal. After that, calculate the average of the points from the graph, assuming a uniform distribution within the categories of the graph, where the categories are different from those in the table. Calculate how much the average given by the graph differs in absolute terms from the average calculated from the raw material?
Points of products:
| Points | Number of products |
| 1-3 | 53 |
| 4-6 | 109 |
| 7-9 | 81 |
| 10-12 | 117 |
| 13-15 | 35 |
| 16-18 | 105 |
Expert Answer:
To calculate the average score from the raw material table we need to determine the midpoint for eac... View the full answer

Related Book For 

Statistics For Business Decision Making And Analysis
ISBN: 9780321890269
2nd Edition
Authors: Robert Stine, Dean Foster
Posted Date:
