

Question: The table below contains data in a non-standardized format as prepared by Newton Inc. for the year 2018 and 2019. Using the data in
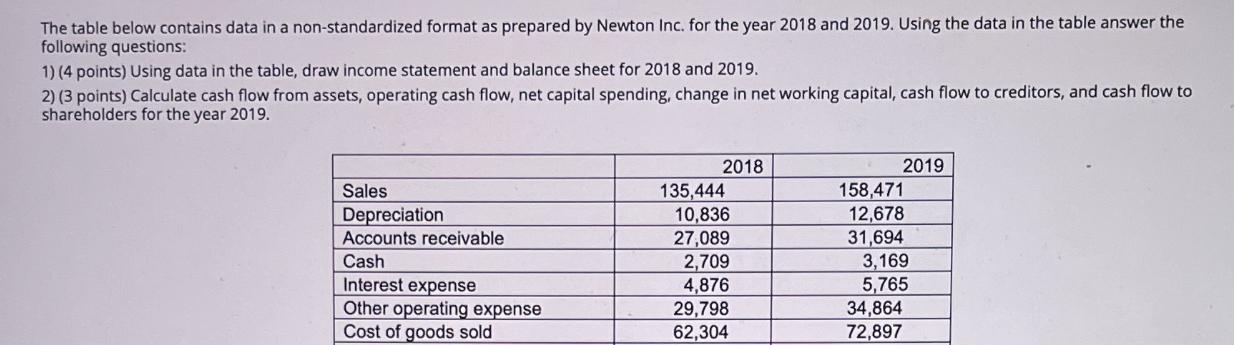
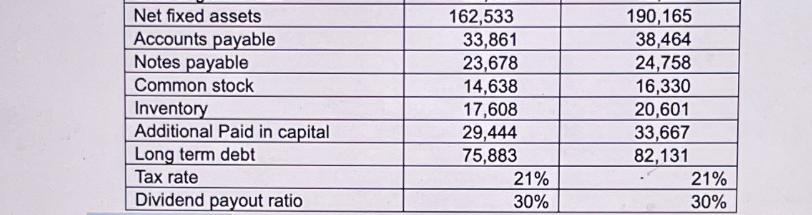
The table below contains data in a non-standardized format as prepared by Newton Inc. for the year 2018 and 2019. Using the data in the table answer the following questions: 1) (4 points) Using data in the table, draw income statement and balance sheet for 2018 and 2019. 2) (3 points) Calculate cash flow from assets, operating cash flow, net capital spending, change in net working capital, cash flow to creditors, and cash flow to shareholders for the year 2019. 2018 2019 Sales Depreciation 135,444 158,471 10,836 12,678 Accounts receivable 27,089 31,694 Cash 2,709 3,169 Interest expense 4,876 5,765 Other operating expense 29,798 34,864 Cost of goods sold 62,304 72,897 Net fixed assets Accounts payable Notes payable 162,533 190,165 33,861 38,464 23,678 24,758 Common stock 14,638 16,330 Inventory 17,608 20,601 Additional Paid in capital 29,444 33,667 Long term debt 75,883 82,131 Tax rate 21% 21% Dividend payout ratio 30% 30%
Step by Step Solution
3.46 Rating (140 Votes )
There are 3 Steps involved in it
Answer Income Statement and Balance Sheet for 2018 and 2019 Incom... View full answer

Get step-by-step solutions from verified subject matter experts