

Question: The table below provides the actual demand and a forecast for the last 12 months of Atwater's Problem Creation Company. Calculate the Cumulative Forecast Error
The table below provides the actual demand and a forecast for the last 12 months of Atwater's Problem Creation Company. Calculate the Cumulative Forecast Error and the Tracking Signal values for the last 12 months. Is the forecast Biased? Does it need to be replaced? 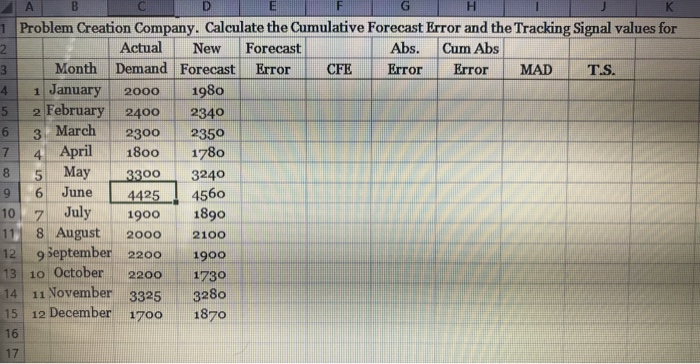
Step by Step Solution
There are 3 Steps involved in it
1 Expert Approved Answer
Step: 1 Unlock

Question Has Been Solved by an Expert!
Get step-by-step solutions from verified subject matter experts
Step: 2 Unlock
Step: 3 Unlock