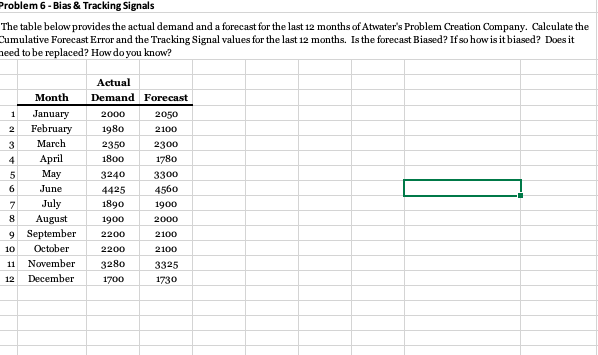
Question: Problem 6 - Bias & Tracking Signals The table below provides the actual demand and a forecast for the last 12 months of Atwater's Problem

Problem 6 - Bias & Tracking Signals The table

Problem 6 - Bias & Tracking Signals The table below provides the actual demand and a forecast for the last 12 months of Atwater's Problem Creation Company. Calculate the Cumulative Forecast Error and the Tracking Signal values for the last 12 months. Is the forecast Biased? If so how is it biased? Does it need to be replaced? How do you know? Month 1 January February 3 March 4 April 5 May 6 June 7 July 8 August 9 September 10 October 11 November 12 December Actual Demand Forecast 2000 2050 1980 2100 2350 2300 1800 1780 3240 3300 4425 4560 1890 1900 1900 2000 2200 2100 2200 2100 3280 3325 1700 1730

Step by Step Solution

There are 3 Steps involved in it

1 Expert Approved Answer
Step: 1 Unlock blur-text-image
Question Has Been Solved by an Expert!

Get step-by-step solutions from verified subject matter experts

Step: 2 Unlock
Step: 3 Unlock

Students Have Also Explored These Related General Management Questions!