

Question: The table describes four possible outcomes for 2017. depending on the level of aggregate demand in that year. Potential GDP is $8 trillion and
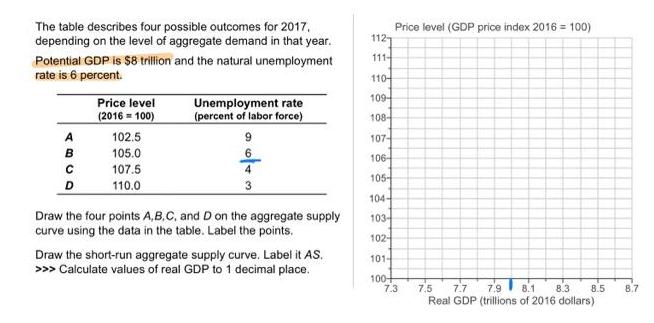
The table describes four possible outcomes for 2017. depending on the level of aggregate demand in that year. Potential GDP is $8 trillion and the natural unemployment rate is 6 percent. ABCD D Price level (2016-100) 102.5 105.0 107.5 110.0 Unemployment rate (percent of labor force) 9 Draw the four points A,B,C, and D on the aggregate supply curve using the data in the table. Label the points. Draw the short-run aggregate supply curve. Label it AS. >>> Calculate values of real GDP to 1 decimal place. Price level (GDP price index 2016 = 100) 1127 111- 110- 109- 108- 107- 106- 105- 104- 103- 102- 101- 100+ 7.3 7,5 7.7 7.9 8.1 8.3 8.5 Real GDP (trillions of 2016 dollars) 8.7
Step by Step Solution
3.34 Rating (148 Votes )
There are 3 Steps involved in it

Get step-by-step solutions from verified subject matter experts