

Question: The UCL and LCL for an X - bar chart are 5 0 and 4 0 respectively. The central line is 4 5 , and
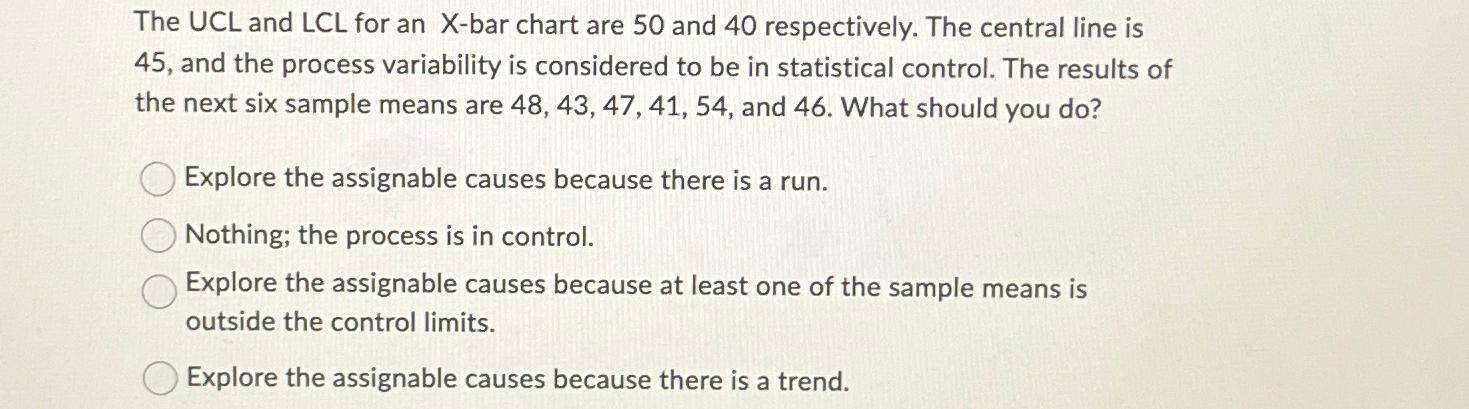
The UCL and LCL for an Xbar chart are and respectively. The central line is and the process variability is considered to be in statistical control. The results of the next six sample means are and What should you do
Explore the assignable causes because there is a run.
Nothing; the process is in control.
Explore the assignable causes because at least one of the sample means is outside the control limits
Explore the assignable causes because there is a trend.
Step by Step Solution
There are 3 Steps involved in it
1 Expert Approved Answer
Step: 1 Unlock

Question Has Been Solved by an Expert!
Get step-by-step solutions from verified subject matter experts
Step: 2 Unlock
Step: 3 Unlock