

Question: this is a 2 part question Question 20 20 pts Plot the following data from the titration of a weak and analyte with a strong
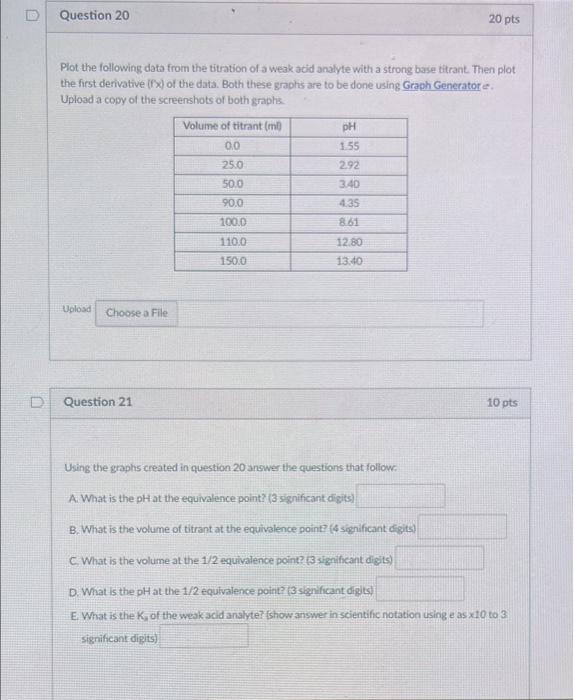
Question 20 20 pts Plot the following data from the titration of a weak and analyte with a strong base titrant. Then plot the first derivative (X) of the data. Both these graphs are to be done using Graph Generatore Upload a copy of the screenshots of both graphs Volume of titrantim pH 00 1.55 25.0 2.92 50.0 3:40 90.0 4.35 100.0 8.61 110.0 12.80 13.40 150.0 Upload Choose a File D Question 21 10 pts Using the graphs created in question 20 answer the questions that follow A: What is the pH at the equivalence point? (3 significant digits) B. What is the volume of titrant at the equivalence point? (4 Significant digit:) C What is the volume at the 1/2 equivalence point? 13 significant digits) D What is the pH at the 1/2 equivalence point: 13 significant digits) E What is the K, of the weak acid analyte? (show answer in scientific notation using e as x10 to 3 significant digits)
Step by Step Solution
There are 3 Steps involved in it

Get step-by-step solutions from verified subject matter experts