

Question: This is a bass diffusion model. 1. Can you describe the situation of product adoption in 4 countries? 2. How to know the product life
This is a bass diffusion model.
1. Can you describe the situation of product adoption in 4 countries?
2. How to know the product life cycle stage of the product in each country? Can you describe the product life cycle stage in each country?
3. A detailed analysis of the charts and data of forecasted adoption and forecasted cumulative adoption in 4 countries.
4. Based on the information obtained, make some recommendations for each country's product strategy.
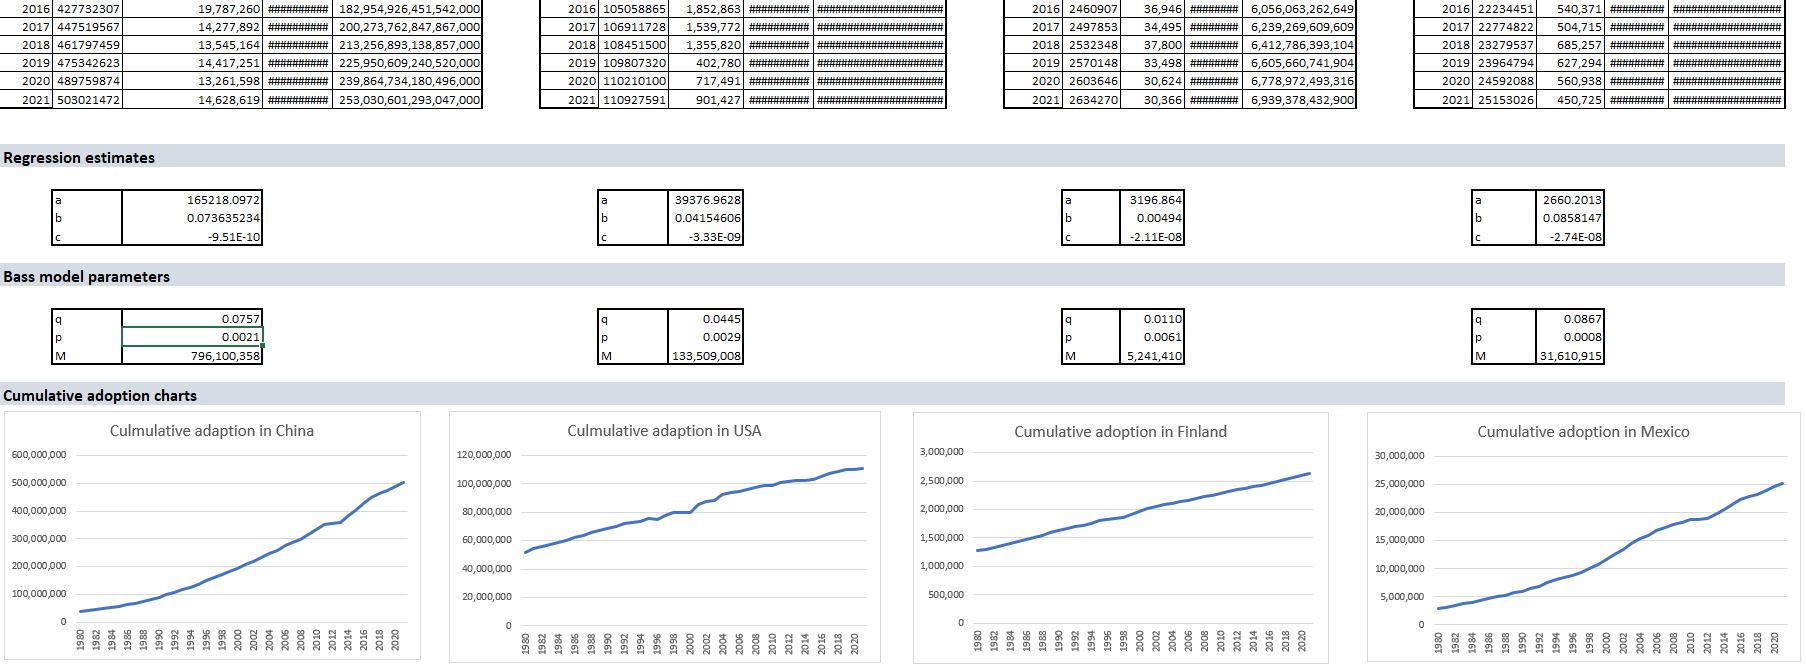
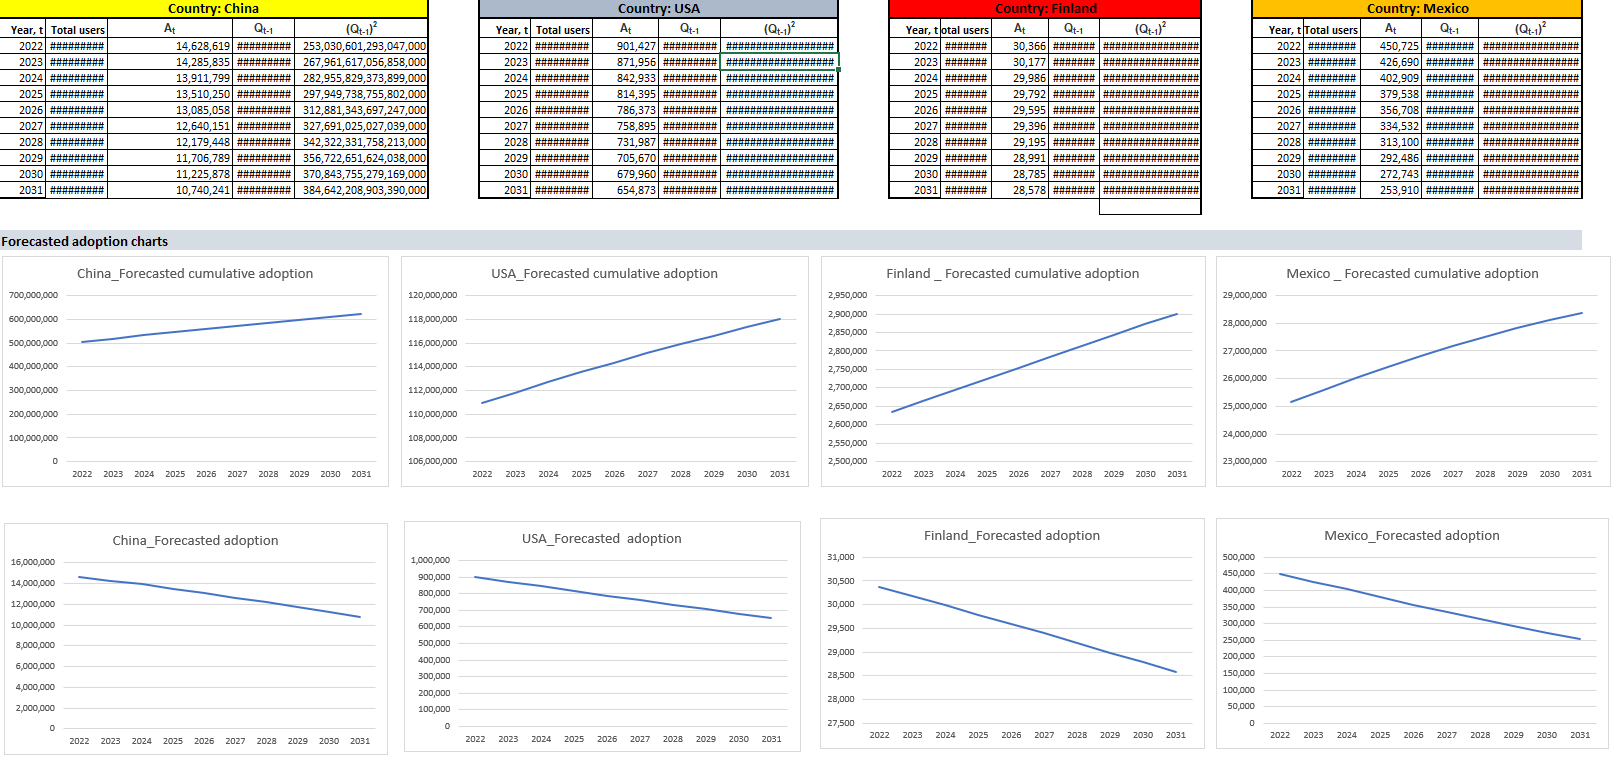
2016 427732307 19,787,260 ##WWWWWW##|182,954,926,451,542,000 2016 105058865 1,852,863 #### 2016 2460907 36,946 #HMMM###| 6,056,063,262,649 2016 22234451 540,371 #HHHHH## 2017 447519567 14,277,892 ##########|200,273,762,847,867,000 2017 106911728 1,539,772 #HHHHHHHH# |# 2017 2497853 34,495 #HHHH###|6,239,269,609,609 2017 22774822 504,715 #HHHHHH## # 2018 461797459 13,545,164 ##########|213,256,893,138,857,000 2018 108451500 1,355,820 #HHHHHHHH# | HHHHHHHH 2018 2532348 37,800 #HHHHHH#|6,412,786,393,104 2018 23279537 685,257 #HHHHHHHH HHHHHHHHAH 2019 475342623 14,417,251 #HHHHHHH## |225,950,609,240,520,000 2019 109807320 402,780 2019 2570148 33,498 #HHHHHH# 6,605,660,741,904 2019 23964794 627,294 # 2020 489759874 13,261,598 #HHHHHHHH#|239,864,734,180,496,000 2020 110210100 717,491 #HHHHHHHH# 2020 2603646 30,624 HHHHHHHH 6,778,972,493,316 2020 24592088 560,938 #HHHHHH## 2021 503021472 14,628,619 #HHHHHHH## | 253,030,601,293,047,000 2021 110927591 901, 427 HHHHHHHHHH | HHHHHHHHHHHHHHHHHHHAP 2021 2634270 30,366 #HHHH### | 6,939,378,432,900 2021 25153026 Regression estimates 165218.0972 39376.9628 3196.864 2660.2013 0.073635234 0.04154606 0.00494 0.0858147 -9.51E-10 -3.33E-09 -2.11E-08 -2.74E-08 Bass model parameters 0.0757 0.0445 .0110 0.0867 0.0021 0.0029 0.0061 0.0008 796,100,358 133,509,008 5,241,410 31,610,915 Cumulative adoption charts Culmulative adaption in China Culmulative adaption in USA Cumulative adoption in Finland Cumulative adoption in Mexico 600,000,000 120,000,000 3,000,000 30,000,000 500,000,000 100,000,000 2,500,000 25,000,000 400,000,000 80,000,000 2,000,000 20,000,000 300,000,000 60,000,000 1,500,000 15,000,000 200,000,000 40,000,000 1,000,000 10,000,000 100,000,000 20,000,000 500,000 5,000,000 0 1994 2000 2006 1988 2012 1996 1998 2002 2004 2008 2010 2016 1990 2014 2018 2020 1982 1994 1984 1986 1992 1988 1990 1992 1996 1998 2000 2004 2002 2006 2008 1980 1984 1986 2010 2014 2018 2012 2016 1992 1994 2008 1982 2020 1996 2004 2000 1988 1990 1996 1998 2002 2004 2006 2012 2016 1980 1986 2006 2010 2014 2012 2016 2014 1980 1982 1984 1986 2010 2018 2020 2000 2008 1980 1982 1992 1998 2002 2018 2020Country: China Country: USA Country: Finland Country: Mexico Year, t Total users At Qt-1 ( Q t-1 ) Year, t Total users At Qt-1 Q+- 1 ) Year, total users At Qt- Q+- 1 ) Year, t Total users A Qt-1 (Q+-1 ) 2022 ######### 14,628,619 #########|253,030,601,293,047,000 2022 ######### 2022 #####8# 2022 ######## 2023 ######### 14,285,835 ######### 267,961,617,056,858,000 2023 ######### 2023 ####### 30,177 ####80# #######8 2023 ######## 426,690 ######## ######## 2024 ######### 13,911,799 #########|282,955,829,373,899,000 2024 ######### 842,933 ######### #HUHHH80818 2024 ####### 29,986 ####### 2024 ######## 402,909 ######## |###### 2025 # 13,510,250 ## 297,949,738,755,802,000 2025 ########8 814,395 ##### 2025 ####### 29,792 # 2025 ######## 879,538 #### 2026 ######### 13,085,058 #########|312,881,343,697,247,000 2026 ######### 786,373 #########|#### 2026 ####### 29,595 ####### |# 2026 ######## 356,708 ######## ###H 2027 ######### 12,640,151 ######### 327,691,025,027,039,000 2027 ######### 758,895 ######### 2027 ####### 29,396 ####### #####1 2027 ######## 334,532 ######## |###### 2028 ###### 12,179,448 #### 342,322,331,758,213,000 2028 ######### 731,987 ## 2028 ####### 29,195 2028 ######## 313,100 2029 ######### 11,706,789 #########|356,722,651,624,038,000 2029 ######### 705,670 #########|#### 2029 ####### 28,991 ######8 2029 ######## 292,486 ######## |###H 2030 ######### 11,225,878 #########|370,843,755,279,169,000 2030 ######### 679,960 #########|######### HUH### 2030 ####### 28,785 ####### ######## 2030 ######## 272,743 ######## ##########H 2031 ######### 10,740,241 #########|384,642,208,903,390,000 2031 ######### 2031 ####### 28,578 ####### ####UHHH######## 2031 ######## 253,910 ######## ##HUHHH######### Forecasted adoption charts China_Forecasted cumulative adoption USA_Forecasted cumulative adoption Finland _ Forecasted cumulative adoption Mexico _ Forecasted cumulative adoption 700,000,000 120,000,DDD 2,950,ODD 29,000,000 600,000,000 118,ODD,DDD 2,900,ODD 28,000,000 2,850,000 500,000,000 116,000,000 27,000,000 400,000,000 114,000,ODD 2,750,000 26,000,000 300,000,000 112,000,DDD 2,700,000 200,000,000 2,650,000 110,000,ODD 25,000,000 2,600,ODD 100,000,000 24,000,000 2,550,ODD 106,ODD,DDD 2,500,000 23,000,000 2022 2023 2024 2025 2026 2027 2028 2029 2030 2031 2022 2023 2024 2025 2026 2027 2028 2029 2030 2031 2022 2023 2024 2025 2026 2027 2028 2029 2030 2031 2022 2023 2024 2025 2026 2027 2028 2029 2030 2031 China_Forecasted adoption USA_Forecasted adoption Finland_Forecasted adoption Mexico_Forecasted adoption 16,000,000 1,000,000 31,000 500,000 14,000,000 900,000 30,500 450,000 800,DDO 400,000 12,000,000 700,D00 30,000 350,000 10,000,000 500,000 29,500 800.000 8,000,000 500,DDO 250,000 29,000 6,000,000 100,0DO 200,000 300,0DO 28,500 150,000 4,000,000 200,000 100,000 2,000,000 28,000 100,000 50,000 0 27,500 2022 2023 2024 2025 2026 2027 2028 2029 2030 2031 2022 2023 2024 2025 2026 2027 2028 2029 2030 2031 2022 2023 2024 2025 2026 2027 2028 2029 2030 2031 2022 2023 4 2025 2026 5 2027 2028 2029 2 2030 2031
Step by Step Solution
There are 3 Steps involved in it

Get step-by-step solutions from verified subject matter experts