

Question: Time Project A Cash Flow Project B Cash Flow -$850 200 200 200 200 200 200 200 -$725 100 250 250 200 100 100 100
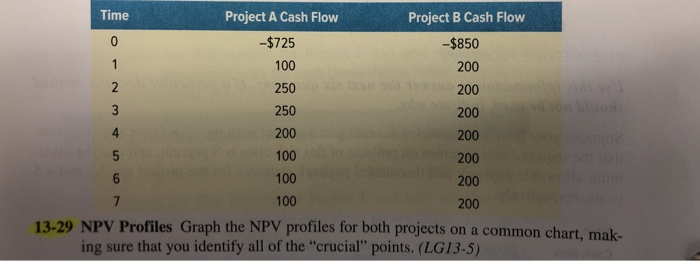
Time Project A Cash Flow Project B Cash Flow -$850 200 200 200 200 200 200 200 -$725 100 250 250 200 100 100 100 4 13-29 NPV Profiles Graph the NPV profiles for both projects on a common chart, mak- ing sure that you identify all of the "crucial" points. (LG13-5)
Step by Step Solution
There are 3 Steps involved in it
1 Expert Approved Answer
Step: 1 Unlock

Question Has Been Solved by an Expert!
Get step-by-step solutions from verified subject matter experts
Step: 2 Unlock
Step: 3 Unlock