Today is the 1st of July 2022. You have been brought in to manage the expansion of
Question:
Today is the 1st of July 2022. You have been brought in to manage the expansion of a company's debt portfolio. The A company, operates a number of tunnels and bridges in the city area. They are unhappy with the way the work their previous CFO has done and hope that your could assist foebetter job. Today is the 1st of July 2022.
Over the next 6 months the company has the following needs:
1. Work will soon begin on a new tunnel. This will require approximately $10 million in cash. You will need to issue new debt to finance this operation.
2. The company is currently experiencing a shortfall in cash flow. As such you will need to issue a further $2.2 million in debt to pay for wages and maintenance.
3. You would like to decrease the sensitivity of your portfolio to changes in the interest rate. Your target range for duration is between 3 and 4.
4. You would like to minimise the cost of funds.
5. You will need to have funds on hand in six months time to pay for any debt repayments that your portfolio will require.
6. You will impose the following restrictions on asset types in your portfolios:
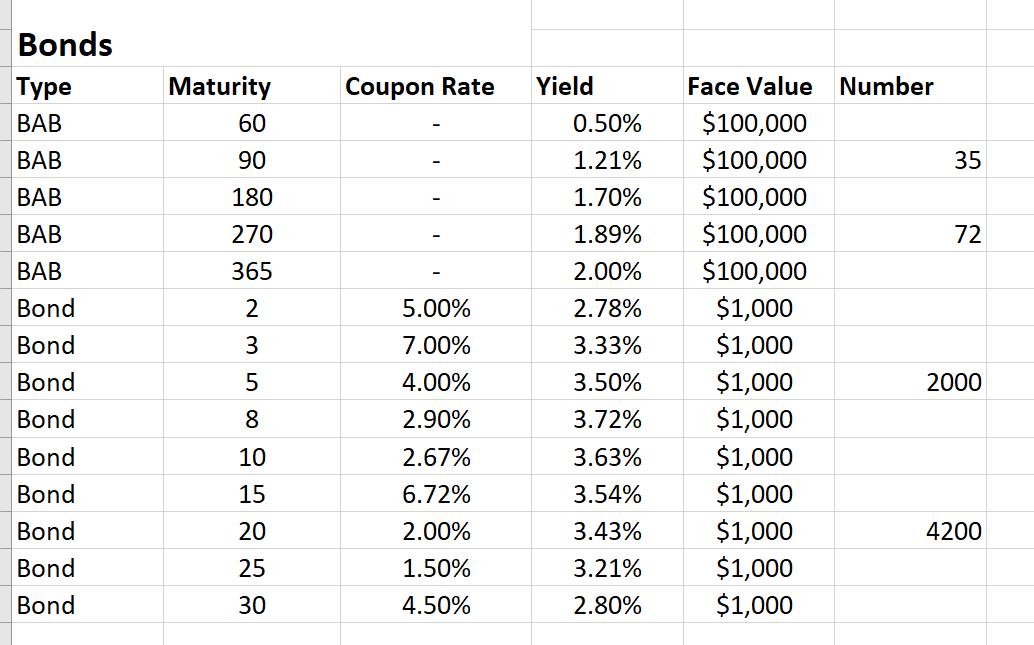
a. BABs - between 25 and 35%
b. Short Term Bonds (2, 3 and 5 Years) between 45 and 55%
c. Medium Term Bonds (8, 10 and 15 Years) between 10 and 20%
d. Long Term Bonds (20, 25 and 30 Years) between 0 and 10%
In addition to this you anticipate that over the next 6 months the company will take in tolls of approximately $1 million (meaning you will have $1 million in cash in January 2023). After paying expenses and taxes you will have $233000 left to make debt repayments. Any amount in excess of this will have to be paid by issuing short term debt.
Your tasks are as follows:
1. Initial Position.
a. Calculate the value of your initial position.
b. Calculate the duration of your portfolio.
c. Draw a graph of the breakdown of your portfolio.
d. Draw a graph illustrating the sensitivity of the current portfolio to parallel shifts in the yield curve.
e. Draw a graph of the current yield curve.
Initial position chart
Expert Answer:
Understood lets continue with the analysis and portfolio optimization for A Company 2 Debt Issuance Plan a New tunnel construction 10 million in new debt b Cash flow shortfall 22 million in new debt c ... View the full answer