

Question: Together with the partial sensitivity analysis fig and the Monte Carlo histogram fig is is the partial sensitivity analysis gure i. = $1 million 0
Together with the partial sensitivity analysis fig and the Monte Carlo histogram fig
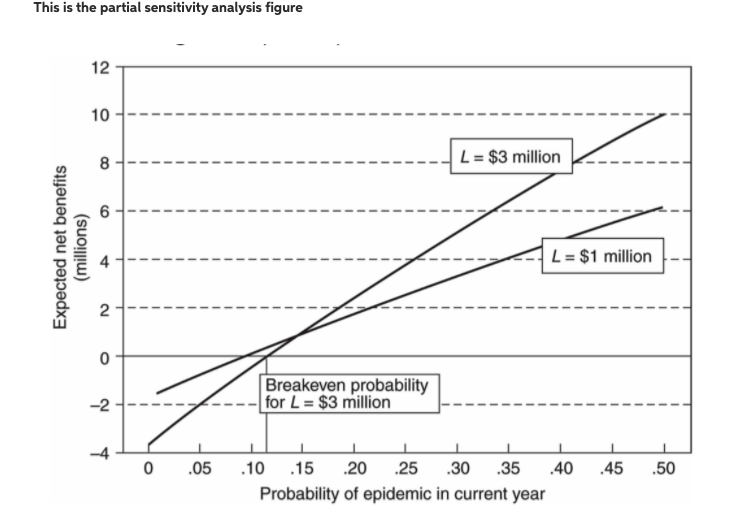

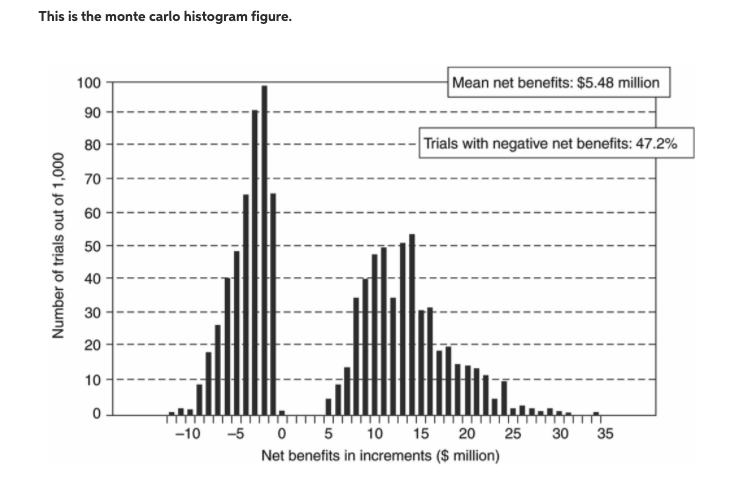
\"is is the partial sensitivity analysis gure i. = $1 million 0 .05 .10 .15 .20 .25 .30 .35 .40 .45 .50 Probability oi epidemic in current year This is the monte carlo histogram figure. 100 Mean net benefits: $5.48 million 90 80 Trials with negative net benefits: 47.2% Number of trials out of 1,000 70 60 50 40 30 20 10 -- - 0 -10 -5 0 5 10 15 20 25 30 35 Net benefits in increments ($ million)
Step by Step Solution
There are 3 Steps involved in it
1 Expert Approved Answer
Step: 1 Unlock

Question Has Been Solved by an Expert!
Get step-by-step solutions from verified subject matter experts
Step: 2 Unlock
Step: 3 Unlock