

Question: Problem for Chapter 13 Analyzing Financial Statements Information below comes from the financial statements of Rosson Company. 2018 2017 Revenues: Net Sales Other Revenues.. Total
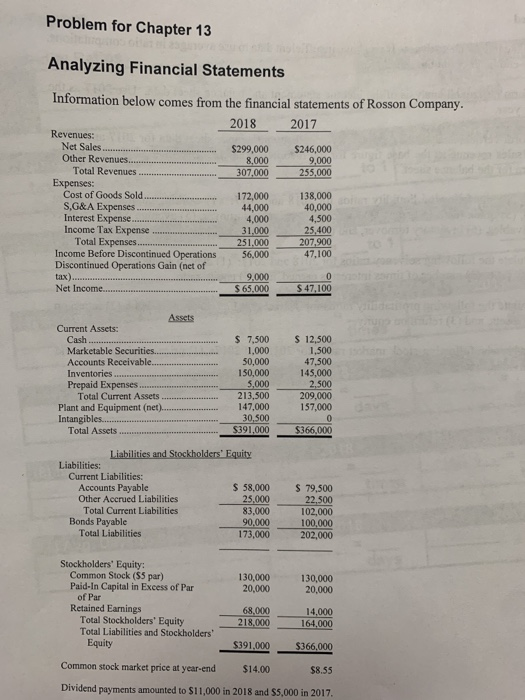
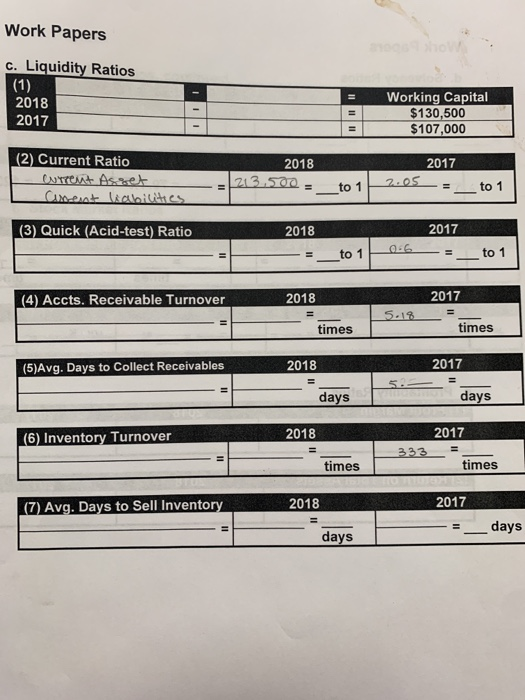
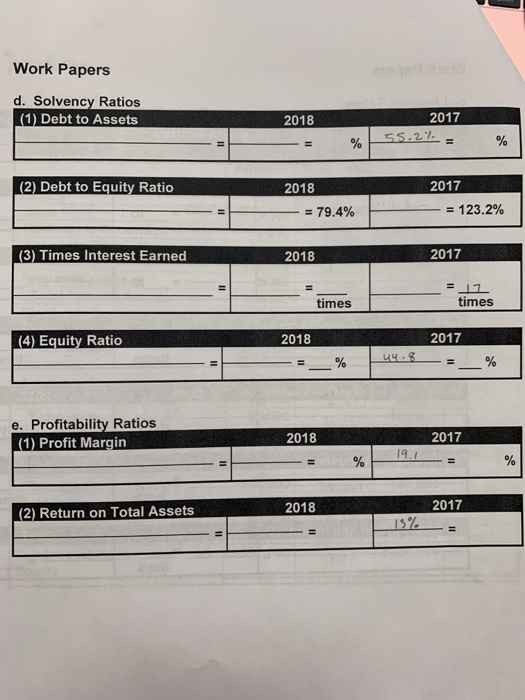
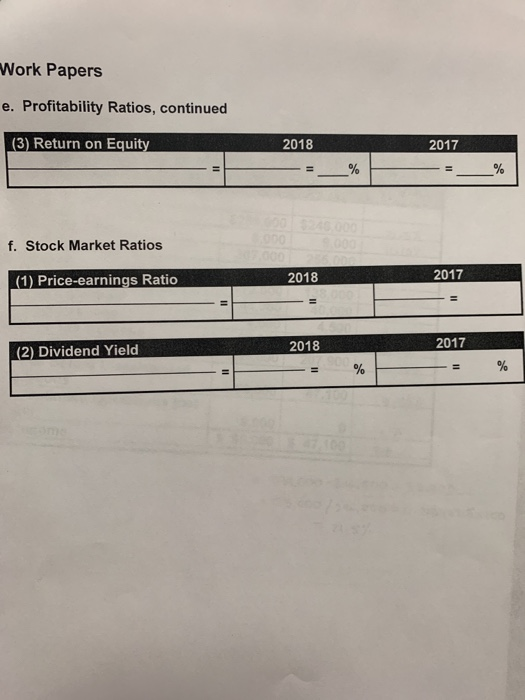
Problem for Chapter 13 Analyzing Financial Statements Information below comes from the financial statements of Rosson Company. 2018 2017 Revenues: Net Sales Other Revenues.. Total Revenues $299,000 8,000 307,000 $246,000 9,000 255,000 Expenses: Cost of Goods Sold S,G&A Expenses Interest Expense.. Income Tax Expense Total Expenses. Income Before Discontinued Operations Discontinued Operations Gain (net of tax) Net Income.. 172,000 44,000 4,000 31,000 251.000 56,000 138,000 40,000 4,500 25,400 207,900 47,100 9,000 $ 65,000 $ 47,100 Assets Current Assets: $ 7,500 $ 12,500 1,500 47,500 145,000 2,500 209,000 157,000 Cash Marketable Securities. 1,000 50,000 150,000 5,000 213,500 147,000 30,500 $391,000 Accounts Receivable Inventories. Prepaid Expenses. Total Current Assets Plant and Equipment (net). Intangibles. $366,000 Total Assets. Liabilities and Stockholders' Equity Liabilities: Current Liabilities: S 79,500 22,500 102,000 100,000 202,000 $ 58,000 25,000 83,000 90,000 173,000 Accounts Payable Other Accrued Liabilities Total Current Liabilities Bonds Payable Total Liabilities Stockholders' Equity: Common Stock ($5 par) Paid-In Capital in Excess of Par of Par Retained Earnings Total Stockholders' Equity Total Liabilities and Stockholders' Equity 130,000 20,000 130,000 20,000 68,000 218,000 14,000 164,000 $391,000 $366,000 Common stock market price at year-end $14.00 $8.55 Dividend payments amounted to $11,000 in 2018 and $5,000 in 2017. Work Papers c. Liquidity Ratios (1) Working Capital $130,500 $107,000 2018 %3D 2017 %3D (2) Current Ratio 2017 2018 CUrrent Asaet Canent liabilities 213.500 2.05- to 1 =_to 1 %3D 2017 (3) Quick (Acid-test) Ratio 2018 0-6 to 1 =_to 1 2017 2018 (4) Accts. Receivable Turnover 5.18 %3D times times 2018 2017 (5)Avg. Days to Collect Receivables days days 2017 2018 (6) Inventory Turnover %3D 333 times times 2017 2018 (7) Avg. Days to Sell Inventory %3D days %3D days Work Papers d. Solvency Ratios 2017 (1) Debt to Assets 2018 SS.2% = %3D (2) Debt to Equity Ratio 2017 2018 = 123.2% = 79.4% 2017 (3) Times Interest Earned 2018 times times 2017 (4) Equity Ratio 2018 .8 e. Profitability Ratios (1) Profit Margin 2017 2018 19.1 2017 2018 (2) Return on Total Assets 15% Work Papers e. Profitability Ratios, continued (3) Return on Equity 2018 2017 00246 000 000 000 f. Stock Market Ratios 000 2017 2018 (1) Price-earnings Ratio 2017 2018 (2) Dividend Yield %3D
Step by Step Solution
There are 3 Steps involved in it

Get step-by-step solutions from verified subject matter experts