

Question: Use the sample statistics to calculate the control limits for the X-bar & R Graphs All units from the current batch Keeping the Process in
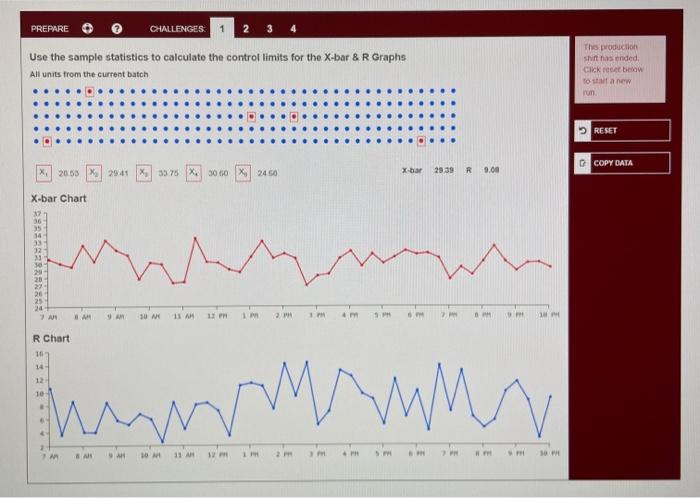
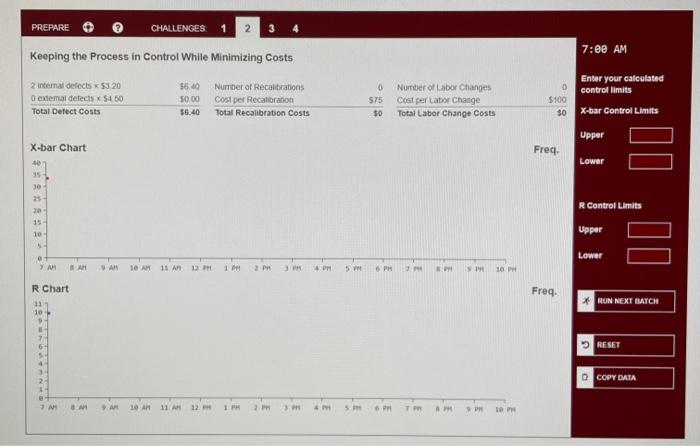
Use the sample statistics to calculate the control limits for the X-bar \& R Graphs All units from the current batch Keeping the Process in Control While Minimizing Costs
Step by Step Solution
There are 3 Steps involved in it
1 Expert Approved Answer
Step: 1 Unlock

Question Has Been Solved by an Expert!
Get step-by-step solutions from verified subject matter experts
Step: 2 Unlock
Step: 3 Unlock