

Question: Transformers in a power system with a single line diagram in the figure operate at 1 5 MVA power, series reactance ( mathrm
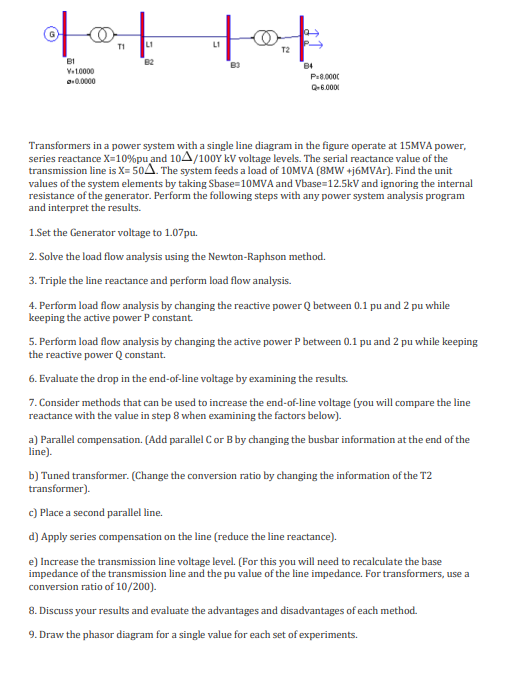
Transformers in a power system with a single line diagram in the figure operate at MVA power, series reactance mathrmXmathrmpu and Delta mathrmYmathrmkV voltage levels. The serial reactance value of the transmission line is mathrmXDelta The system feeds a load of MVA mathrmMWmathrmjmathrmMVAr Find the unit values of the system elements by taking Sbase mathrmMVA and mathrmVbasemathrmkV and ignoring the internal resistance of the generator. Perform the following steps with any power system analysis program and interpret the results.
Set the Generator voltage to pu
Solve the load flow analysis using the NewtonRaphson method.
Triple the line reactance and perform load flow analysis.
Perform load flow analysis by changing the reactive power Q between pu and pu while keeping the active power P constant.
Perform load flow analysis by changing the active power P between pu and pu while keeping the reactive power Q constant.
Evaluate the drop in the endofline voltage by examining the results.
Consider methods that can be used to increase the endofline voltage you will compare the line reactance with the value in step when examining the factors below
a Parallel compensation. Add parallel C or B by changing the busbar information at the end of the line
b Tuned transformer. Change the conversion ratio by changing the information of the T transformer
c Place a second parallel line.
d Apply series compensation on the line reduce the line reactance
e Increase the transmission line voltage level. For this you will need to recalculate the base impedance of the transmission line and the pu value of the line impedance. For transformers, use a conversion ratio of
Discuss your results and evaluate the advantages and disadvantages of each method.
Draw the phasor diagram for a single value for each set of experiments.
Step by Step Solution
There are 3 Steps involved in it
1 Expert Approved Answer
Step: 1 Unlock

Question Has Been Solved by an Expert!
Get step-by-step solutions from verified subject matter experts
Step: 2 Unlock
Step: 3 Unlock