

Question: U that ent an application that creates a histogram Design and implement an applica lows you to visually ly inspect the frequency distribution of that
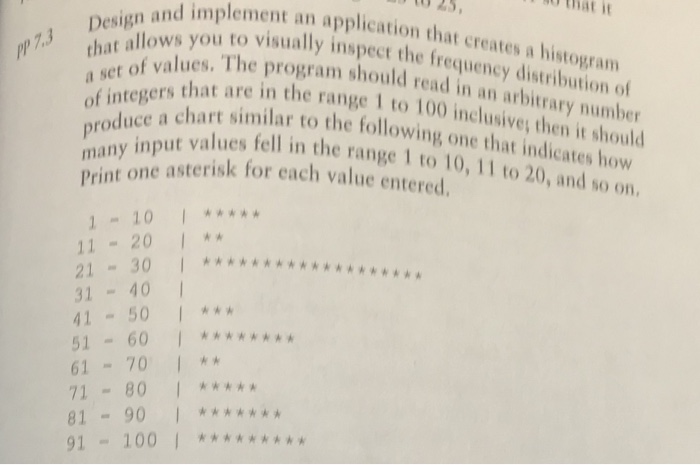
U that ent an application that creates a histogram Design and implement an applica lows you to visually ly inspect the frequency distribution of that a. The program should read in an arbitrary number t al a set of val of integers produce a rs that are in the range 1 to 100 inclusive, then it should that indicates how ny input values tell in the range 1 to 10, 11 to 20 nlnoestisk for each value entered , and so on 1 -10 I 11 20 21=30 ! 31 40 41 50 1 -60 A 61 70 I 71 81 -90 91 100AN
Step by Step Solution
There are 3 Steps involved in it
1 Expert Approved Answer
Step: 1 Unlock

Question Has Been Solved by an Expert!
Get step-by-step solutions from verified subject matter experts
Step: 2 Unlock
Step: 3 Unlock