

Question: Upload Water data and compare Persons to Water Usage. Create a scattered plot chart with X representing Persons and Y representing Water Usage; plot the
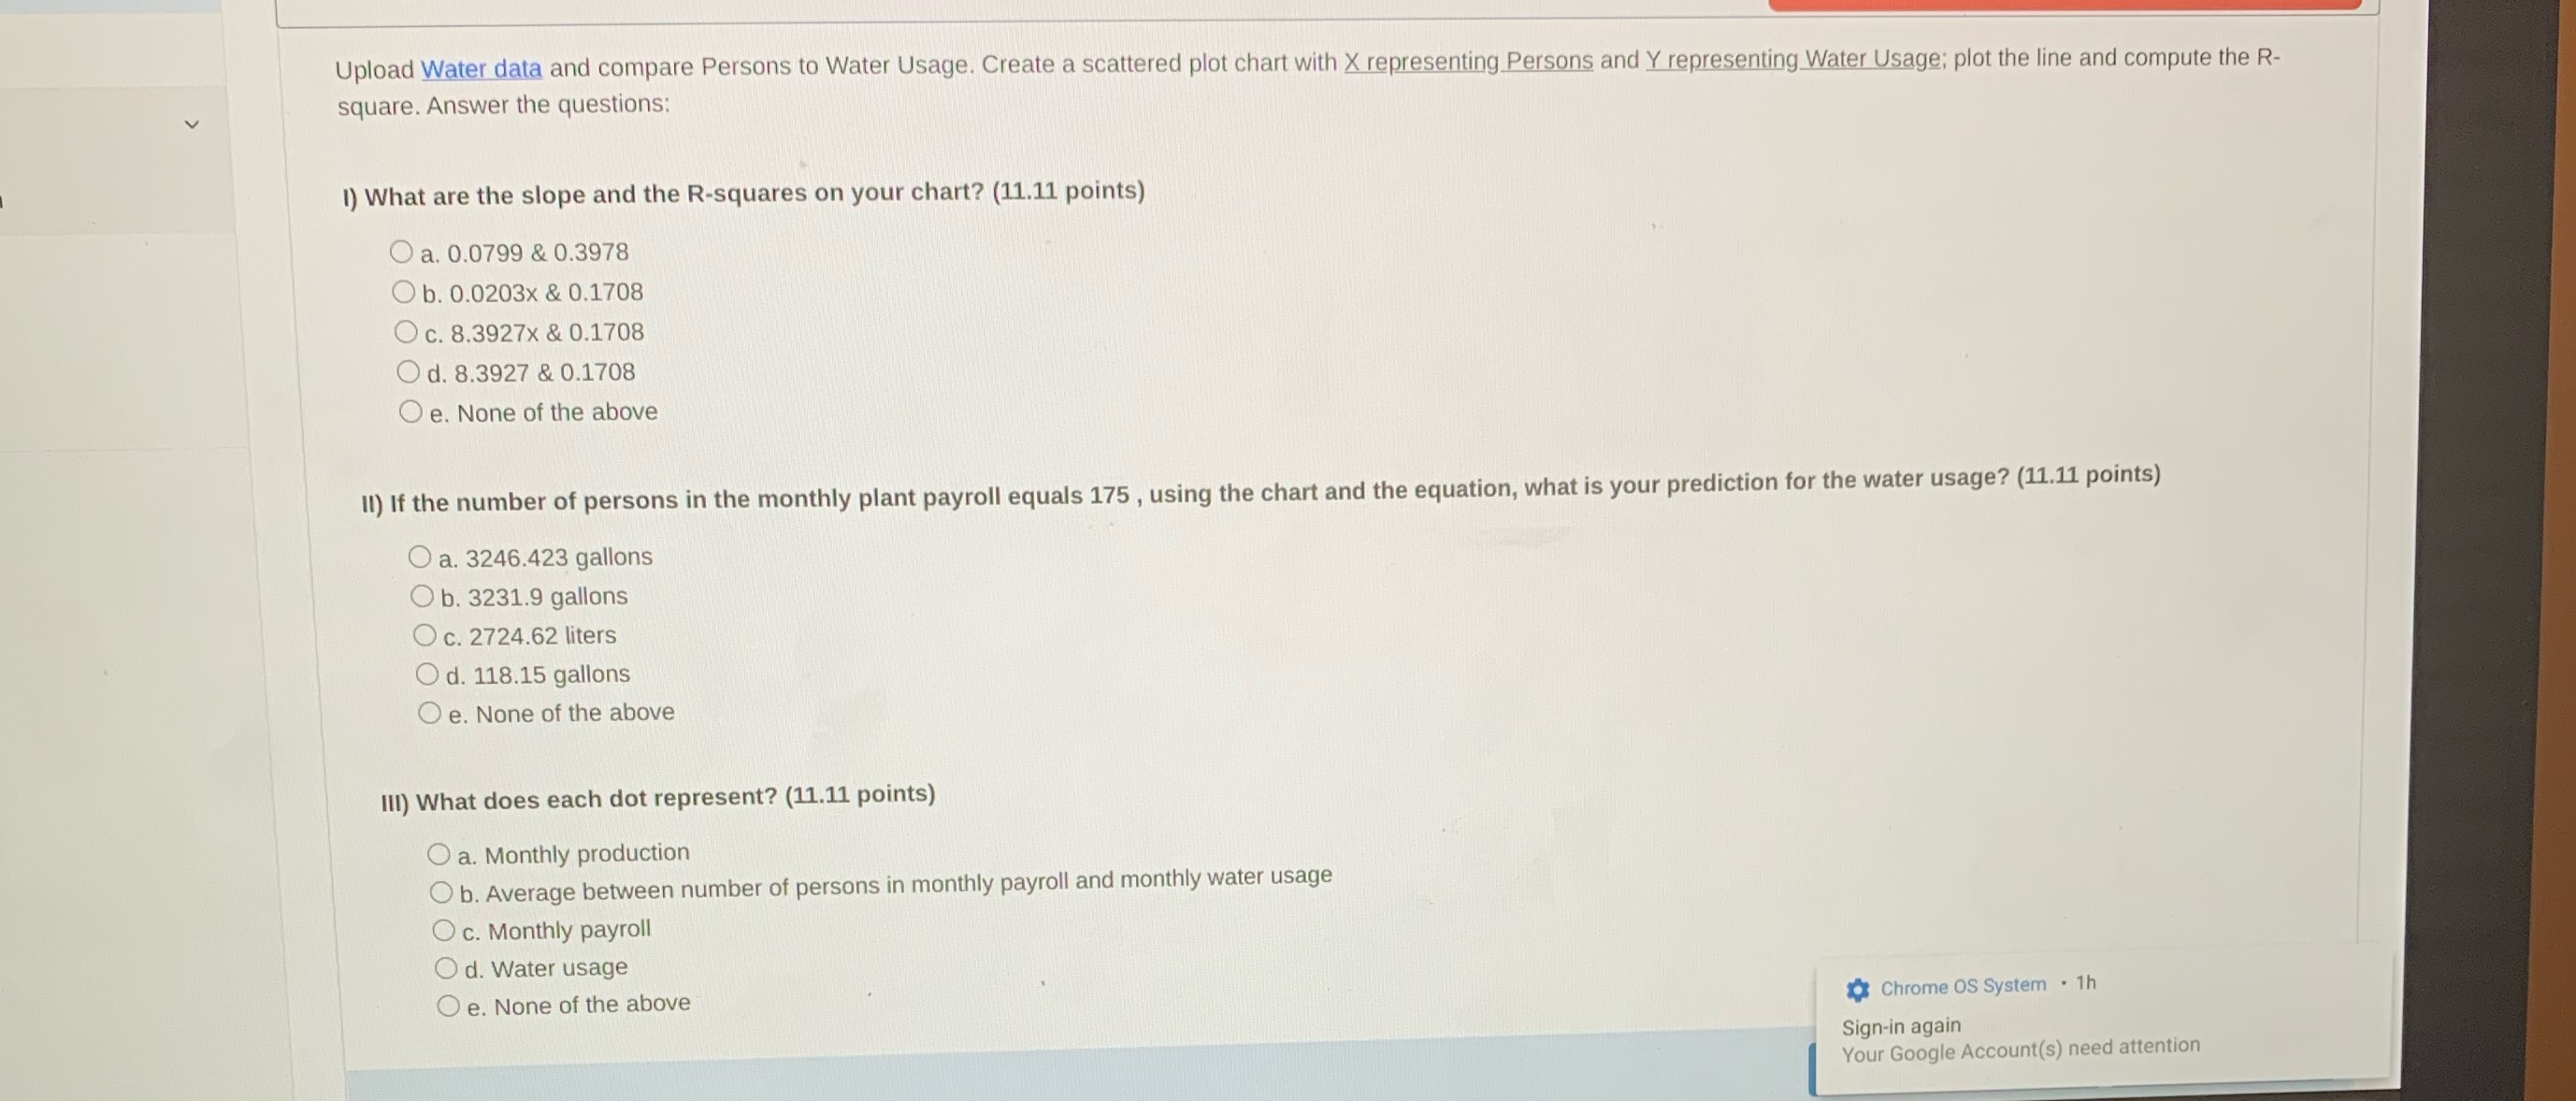
Upload Water data and compare Persons to Water Usage. Create a scattered plot chart with X representing Persons and Y representing Water Usage; plot the line and compute the R- square. Answer the questions: 1) What are the slope and the R-squares on your chart? (11.11 points) O a. 0.0799 & 0.3978 O b. 0.0203x & 0.1708 O c. 8.3927x & 0.1708 Od. 8.3927 & 0.1708 O e. None of the above Il) If the number of persons in the monthly plant payroll equals 175 , using the chart and the equation, what is your prediction for the water usage? (11.11 points) O a. 3246.423 gallons O b. 3231.9 gallons O c. 2724.62 liters Od. 118.15 gallons Oe. None of the above Ill) What does each dot represent? (11.11 points) O a. Monthly production O b. Average between number of persons in monthly payroll and monthly water usage O c. Monthly payroll O d. Water usage O e. None of the above Chrome OS System . 1h Sign-in again Your Google Account(s) need attention
Step by Step Solution
There are 3 Steps involved in it

Get step-by-step solutions from verified subject matter experts