

Question: Use Excel to create a connected scatter plot of Total Annual Ordering Costs, Total Annual Holding Costs and Total Cost using the following: annual demand
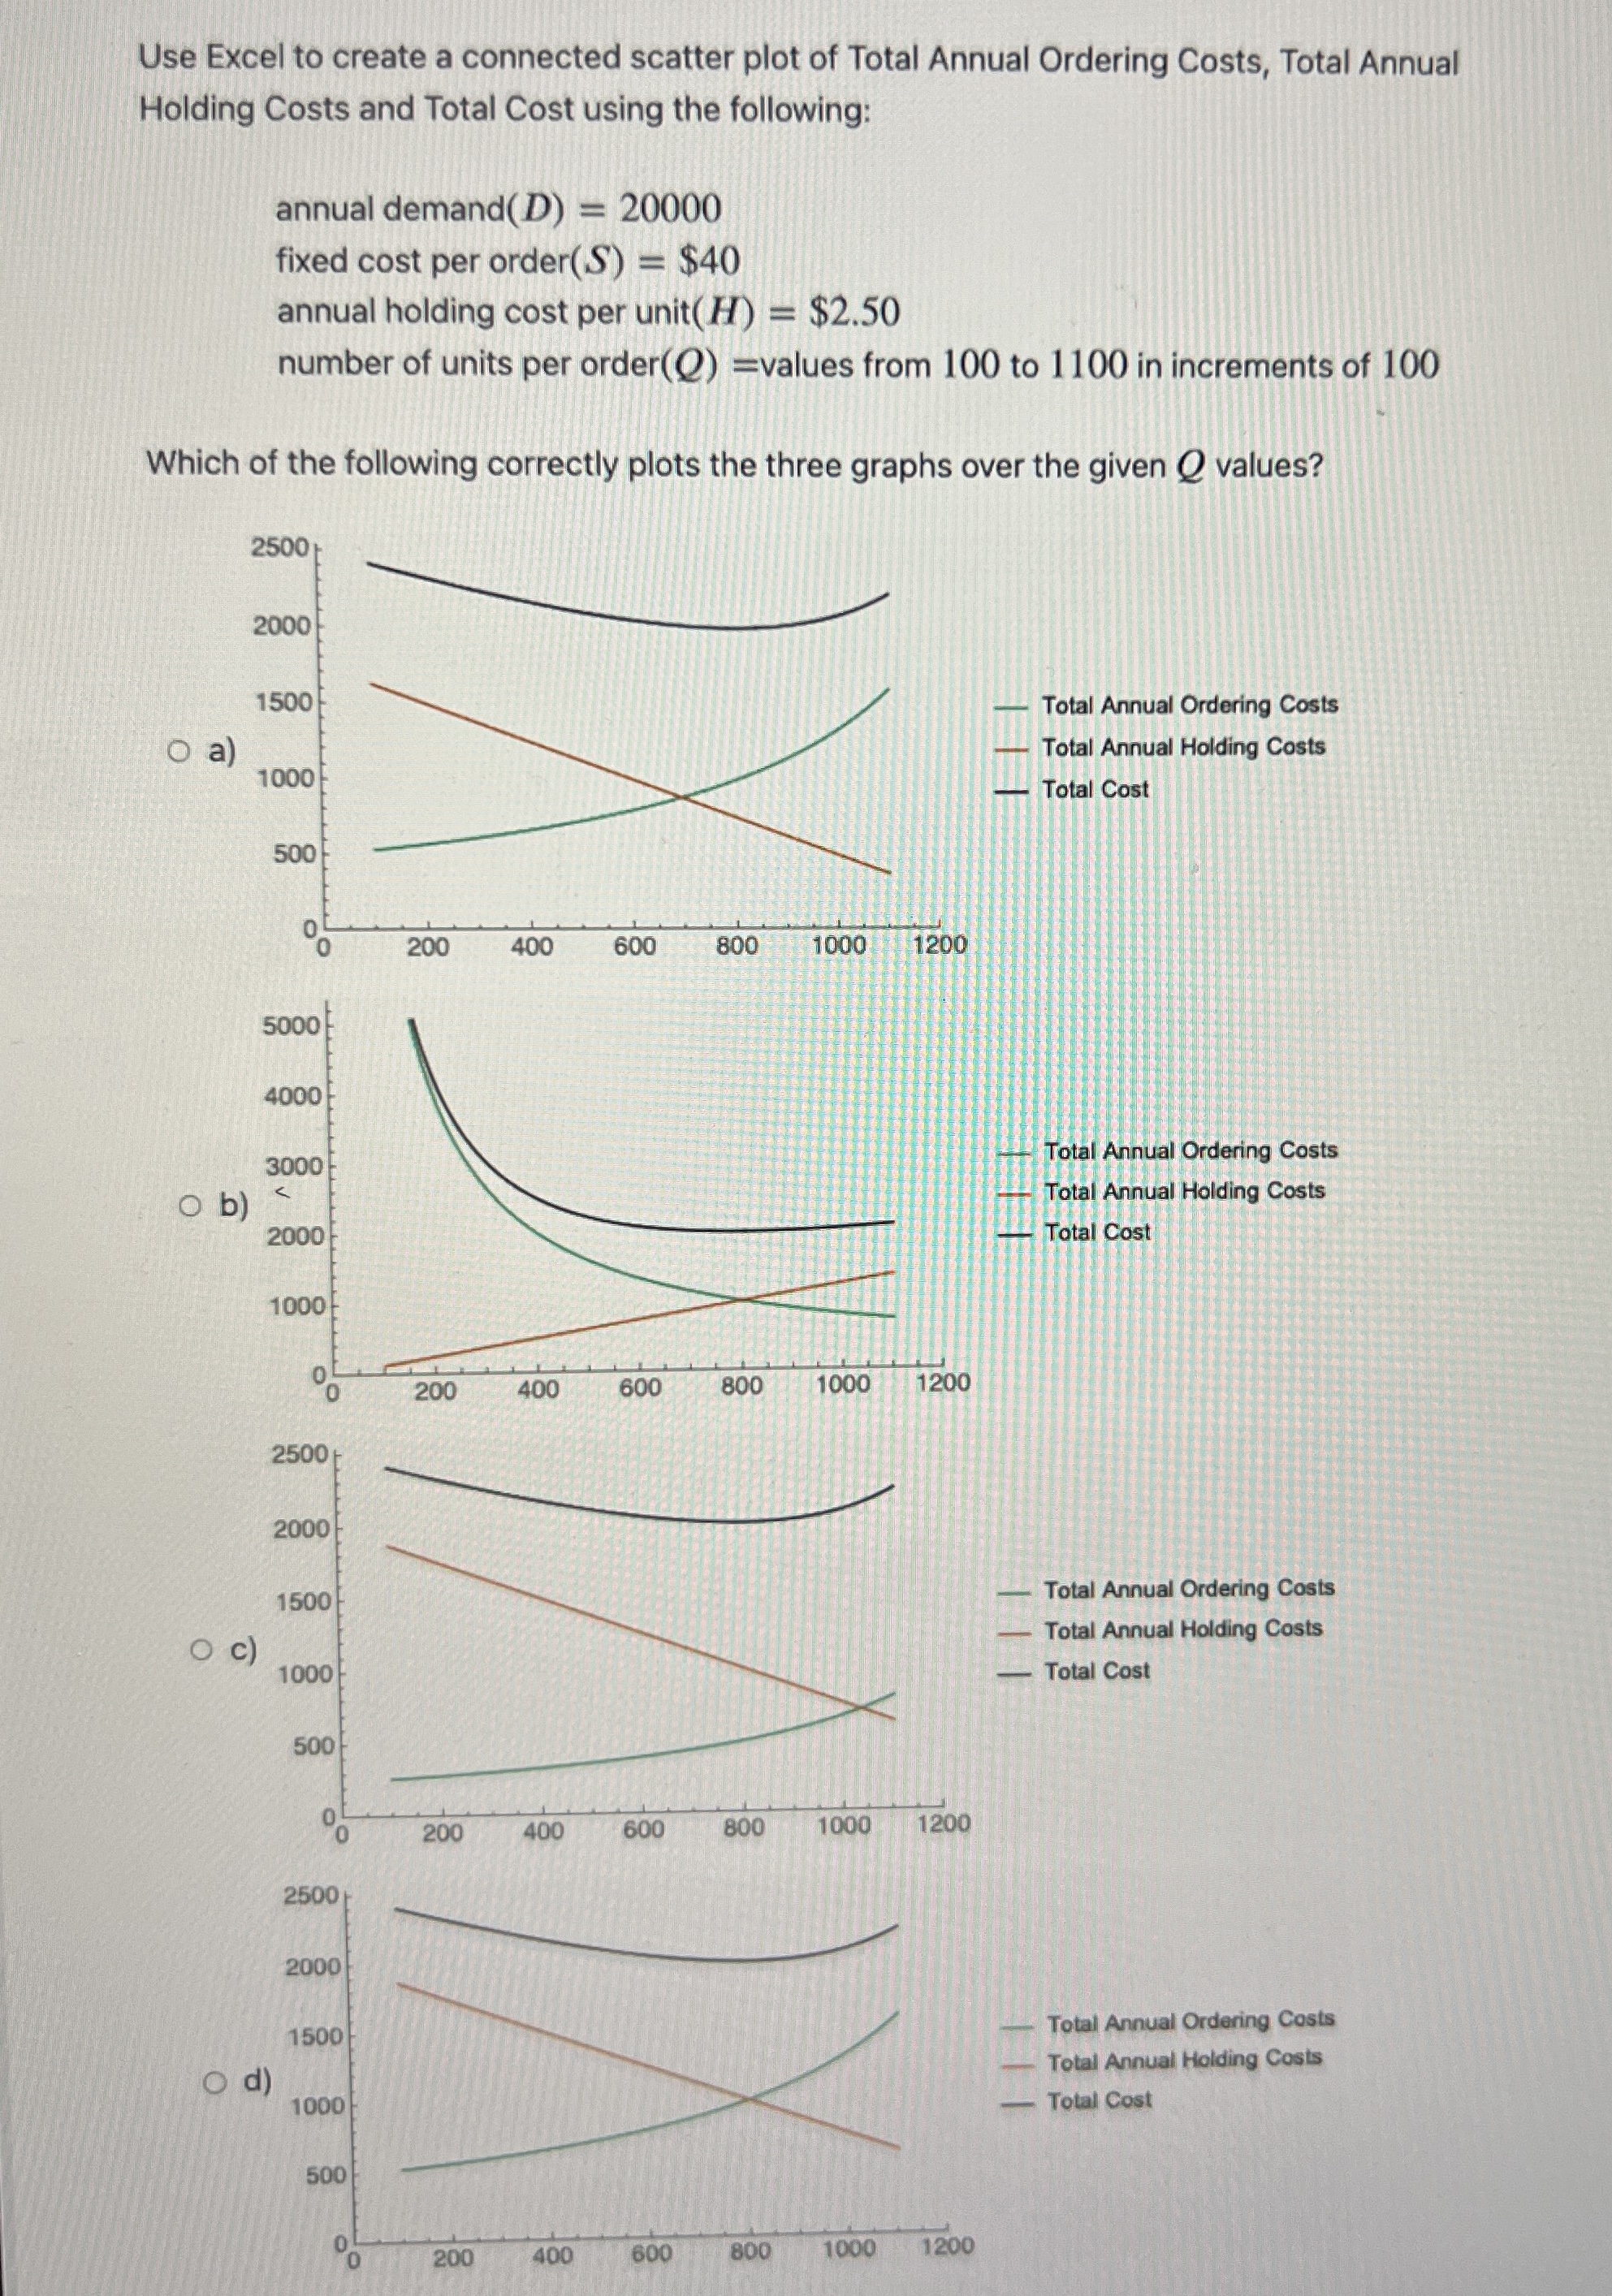
Use Excel to create a connected scatter plot of Total Annual Ordering Costs, Total Annual Holding Costs and Total Cost using the following:
annual demand
fixed cost per order$
annual holding cost per unit $
number of units per order values from to in increments of
Which of the following correctly plots the three graphs over the given values?
Total Annual Ordering Costs
Total Annual Holding Costs
Total Cost
Step by Step Solution
There are 3 Steps involved in it
1 Expert Approved Answer
Step: 1 Unlock

Question Has Been Solved by an Expert!
Get step-by-step solutions from verified subject matter experts
Step: 2 Unlock
Step: 3 Unlock