Question: Use Home Depot's financial information in Appendix A . a. Compute the ROI and EVA for the two most recent years reported. Use Net Earnings
Use Home Depot's financial information in Appendix A.
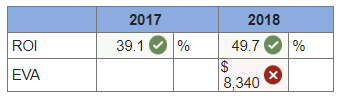
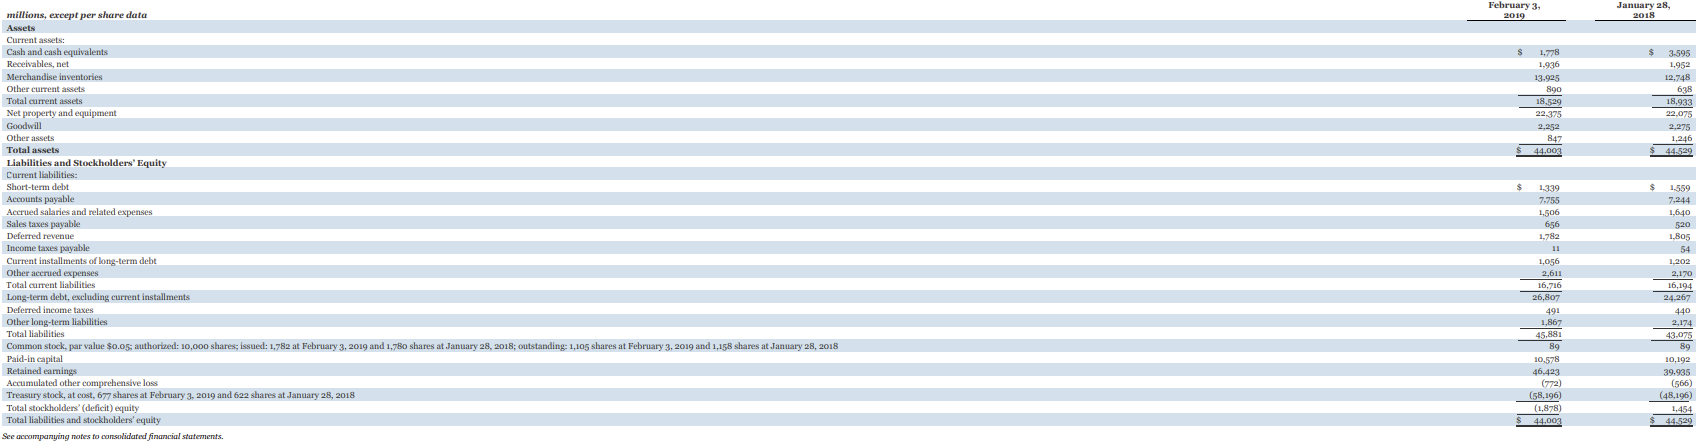
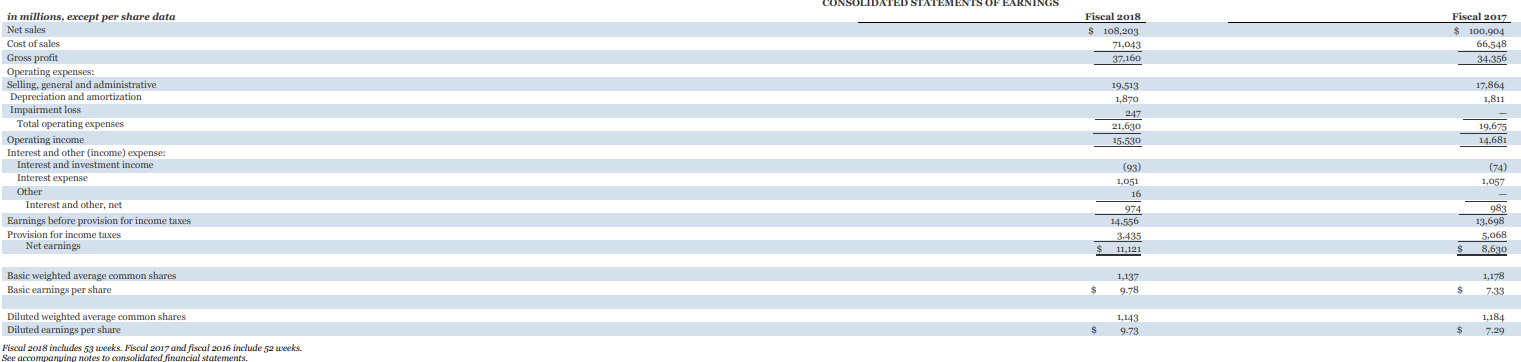
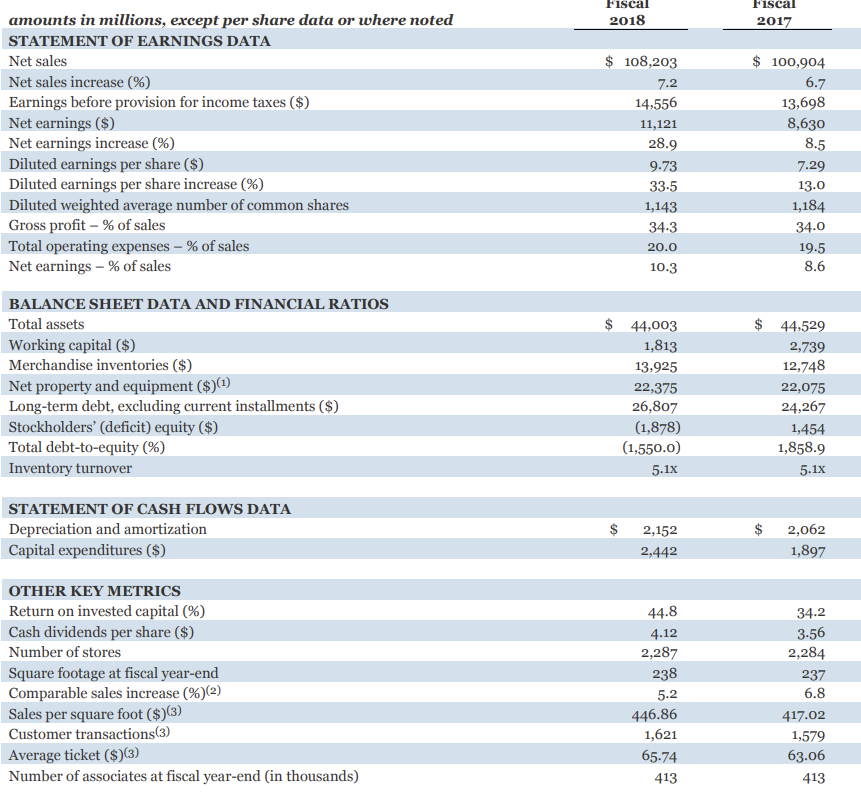
a. Compute the ROI and EVA for the two most recent years reported. Use Net Earnings as a measure of earnings or returns, and Net Property and Equipment as the invested capital base. Assume the weighted-average cost of capital is 10 percent.
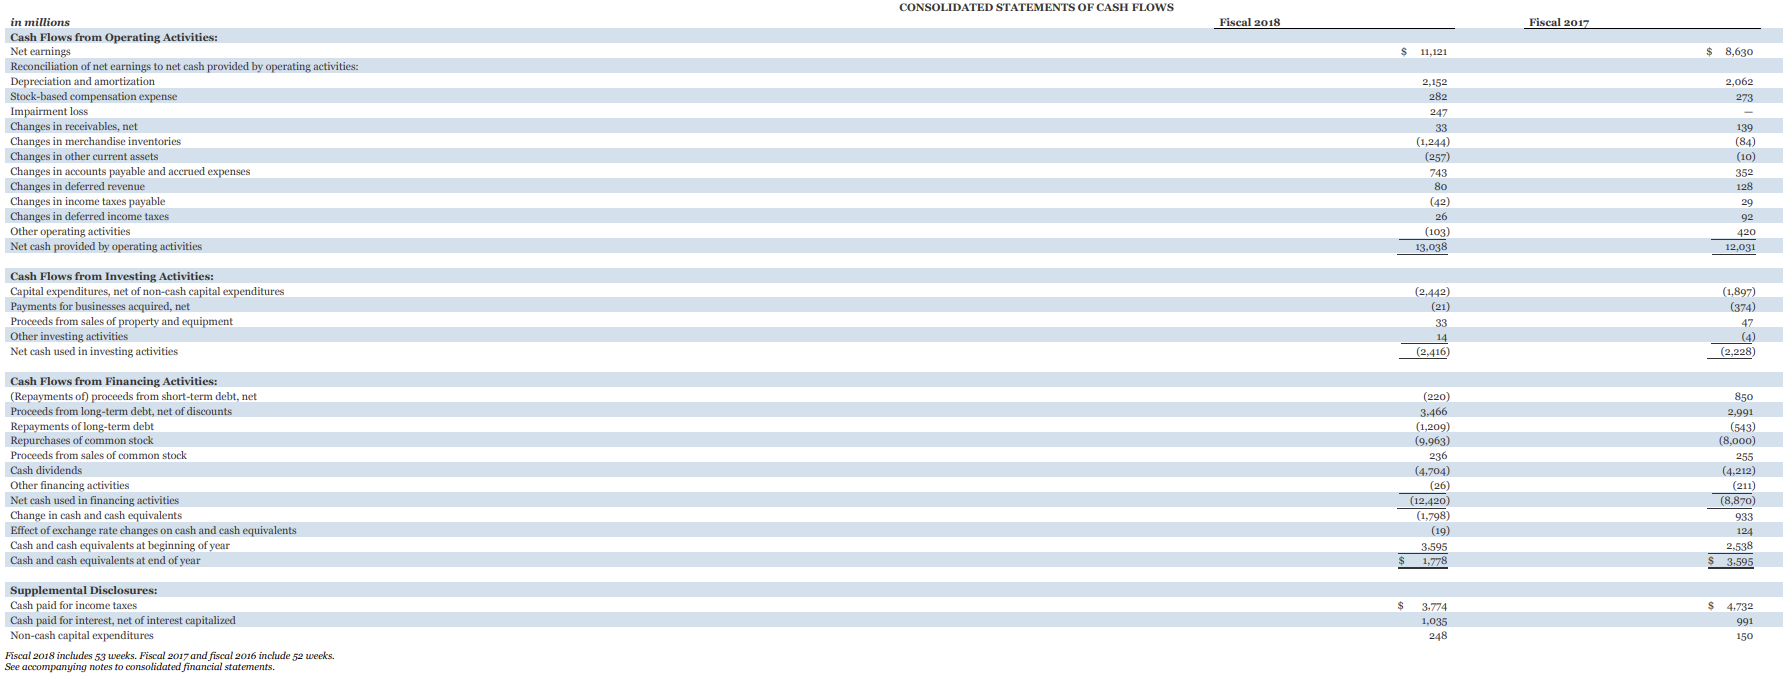
\fCONSOLIDATED STATEMENTS OF CASH FLOWS in millions Fiscal 2018 Fiscal 2017 Cash Flows from Operating Activities: Net earnings $ 11,121 $ 8,630 Reconciliation of net earnings to net cash provided by operating activities: Depreciation and amortization 2,152 2,062 Stock-based compensation expense 282 273 Impairment loss 247 Changes in receivables, net 33 139 Changes in merchandise inventories (1,244) (84) Changes in other current assets (257) (10) Changes in accounts payable and accrued expenses 743 352 Changes in deferred revenue 80 128 Changes in income taxes payable (42) 29 Changes in deferred income taxes 26 92 Other operating activities (103) 420 Net cash provided by operating activities 13,038 12,031 Cash Flows from Investing Activities: Capital expenditures, net of non-cash capital expenditures (2,442) (1,897) Payments for businesses acquired, net (21) (374) Proceeds from sales of property and equipment 33 47 Other investing activities 14 (4) Net cash used in investing activities (2,416) (2,228) Cash Flows from Financing Activities: (Repayments of) proceeds from short-term debt, net (220) 850 Proceeds from long-term debt, net of discounts 3,466 2,991 Repayments of long-term debt (1,209) (543) Repurchases of common stock (9,963) (8,000) Proceeds from sales of common stock 236 255 Cash dividends (4,704) (4,212) Other financing activities (26) (211) Net cash used in financing activities (12,420) (8,870 ) Change in cash and cash equivalents (1,798) 933 Effect of exchange rate changes on cash and cash equivalents (19) 124 Cash and cash equivalents at beginning of year 3:595 2,538 Cash and cash equivalents at end of year 1,778 $ 3.595 Supplemental Disclosures: Cash paid for income taxes $ 3,77 S 4.732 Cash paid for interest, net of interest capitalized 1,035 991 Non-cash capital expenditures 248 150 Fiscal 2018 includes 53 weeks. Fiscal 2017 and fiscal 2016 include 52 weeks. See accompanying notes to consolidated financial statements.millions, except per share data February January 28, Assets 2019 2018 Current assets: Cash and cash equivalents Receivables, net 1,778 3-595 1,936 Merchandise inventories 1,952 Other current assets 13.925 12,748 Total current assets 890 636 Net property and equipment 18,529 18,933 Goodwill 22.375 22.075 2.252 Other assets 2,275 Total assets 847 1,246 Liabilities and Stockholders' Equity 44.003 44.529 Current liabilities: Short-term debt Accounts payable 1,339 $ 1,559 7,755 Accrued salaries and related expenses 7,244 Sales taxes payable 1,506 1,640 Deferred revenue 656 520 -782 Income taxes payable 1,805 54 Current installments of long-term debt Other accrued expenses 1,056 1,202 Total current liabilities 2,611 2,170 Long-term debt, excluding current installments 16,716 16,194 Deferred income taxes 26,807 24.267 Other long-term liabilities 491 440 Total liabilities 1,867 2,174 Common stock, par value $0.05; authorized: 10,000 shares; issued: 1,782 at February 3, 2019 and 1,780 shares at January 28, 2018; outstanding: 1,105 shares at February 3, 2019 and 1,158 shares at January 28, 2018 45.881 13-075 Paid-in capital 89 Retained earnings 10,578 10,192 Accumulated other comprehensive loss 16,423 39.935 Treasury stock, at cost, 677 shares at February 3, 2019 and 622 shares at January 28, 2018 (772) (566) Total stockholders' (deficit) equity (58,196) (48,196) Total liabilities and stockholders' equity (1,878) 1,454 44.003 44-529 anying notes to consolidated financial statements.in millions, except per share data Fiscal 2018 Fiscal 2017 Net sales $ 108,203 $ 100,904 Cost of sales 71,043 66,548 Gross profit 37,160 34.356 Operating expenses: Selling, general and administrative 19,513 17,864 Depreciation and amortization 1,870 1,811 Impairment loss 247 Total operating expenses 21,630 19,675 Operating income 15.530 14,681 Interest and other (income) expense: Interest and investment income (93) (74) Interest expense 1,051 1,057 Other 16 Interest and other, net 974 983 Earnings before provision for income taxes 14.556 13,698 Provision for income taxes 3.435 5,068 Net earnings 11,121 8,630 Basic weighted average common shares 1,137 1,178 Basic earnings per share 9.78 7.33 Diluted weighted average common shares 1,143 1,184 Diluted earnings per share S 9-73 7.29 Fiscal 2018 includes 53 weeks. Fiscal 2017 and fiscal 2016 include 52 weeks.I'lSal ELK-Ci\". amounts in million, except per share data or where noted 2018 2017 STATEMENT OF EARNINGS DATA Net sales 3; 103,203 $ 109,904 Net sales increase [96) 7.2 6.7 Earnings before provision for income taxes ($) 14,556 13,698 Net earnings [55] 11,121 3,630 Net earnings increase (96] 28.9 8.5 Diluted earnings per share ($] 9.73 7.29 Diluted earnings per share increase {96] 33.5 13.0 Diluted weighted average number of common shares 1,143 1,134 Gross prot 96 of sales 34.3 34.0 Total operating expenses $6 of sales 20.0 19.5 Net earnings 96 of sales 10.3 8.6 BALANCE SHEET DATA AND FINANCIAL RATIOS Total assets 5 44,003 $ 44,529 Working capital ($) 1,313 2,739 Merchandise inventories (3} 13,925 12,748 Net property and equipment ($21\") 22,375 22,075 Longterm debt, excluding current installments {5] 26,83? 24,26? Stockholders' (decit) equity If$} [1,373] 1,454 Total debttoequity (96] (1,550.0) 1,353.9 Inventory tumever 5.1x 5.1x STATEMENT OF CASH FLOWS DATA Depreciation and amortization 5 2,152 $ 2,062 Capital expenditures [$] 2,442 1,397 OTHER KEY METRICS Retum on invested capital (96) 44.8 34.2 Cash dividends per share [$} 4.12 3.56 Number of stores 2,287 2,284 Square footage at scal year-end 233 237 Comparable sales increase {96](23 5.2 6.8 Sales per square feet [$1333 446.3 417.02 Customer transactions} 1,621 1,579 Average ticket [$il3} 65.74 63.06 Number of associates at fiscal year-end (in thousands] 413 413
Step by Step Solution
There are 3 Steps involved in it
1 Expert Approved Answer
Step: 1 Unlock
Question Has Been Solved by an Expert!
Get step-by-step solutions from verified subject matter experts
Step: 2 Unlock
Step: 3 Unlock
Students Have Also Explored These Related Finance Questions!