

Question: Use MATLAB to plot the following functions: For these functions make the values of the variable t between -5 to +5 and use the built-in
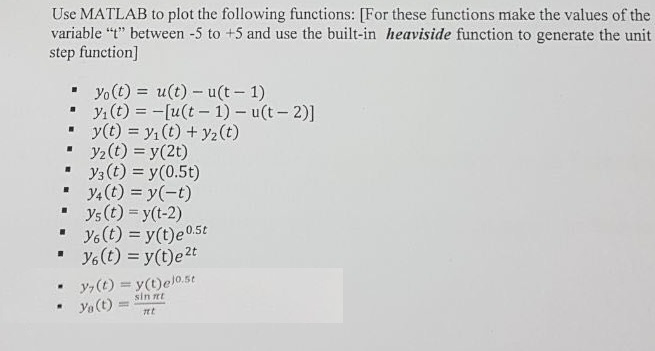
Use MATLAB to plot the following functions: For these functions make the values of the variable "t" between -5 to +5 and use the built-in heaviside function to generate the unit step function] y_0(t) = u(t) - u(t -1) y_1(t) = -[u(t - 1) - u (t - 2)] y(t) = y_1(t) + y_2 (t) y_2(t) = y(0.5t) y_4(t) = y(-t) y_5(t) = y(t - 2) y_6(t) = y(t)e^0.5 t y_7(t) = y (t) e^j 0.5t y_8 (t) = sin pi t/pi t
Step by Step Solution
There are 3 Steps involved in it
1 Expert Approved Answer
Step: 1 Unlock

Question Has Been Solved by an Expert!
Get step-by-step solutions from verified subject matter experts
Step: 2 Unlock
Step: 3 Unlock