

Question: Use numpy, matplotlib.pyplot, itertools only For this part, we will analyze via simulation, the effect of probability of error in a binary symmetric channel (BSC)
Use numpy, matplotlib.pyplot, itertools only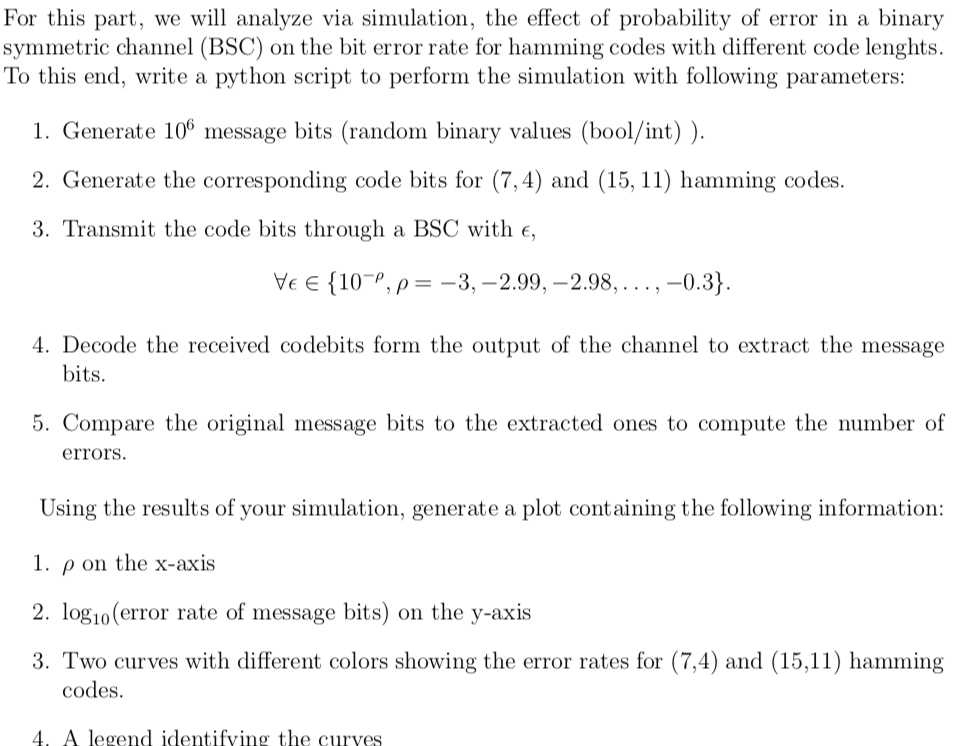
For this part, we will analyze via simulation, the effect of probability of error in a binary symmetric channel (BSC) on the bit error rate for hamming codes with different code lenghts To this end, write a python script to perform the simulation with following parameters: 1. Generate 10 message bits (random binary values (bool/int)) 2. Generate the corresponding code bits for (7,4) and (15, 11) hamming codes 3. Transmit the code bits through a BSC with e, Ye E { 10%, =-3,-2.99.-2.98. . . . ,-0.3} 4. Decode the received codebits form the output of the channel to extract the message bits 5. Compare the original message bits to the extracted ones to compute the number of errors Using the results of your simulation, generate a plot containing the following information: 1, on the x-axis 2. log1o (error rate of message bits) on the y-axis 3. Two curves with different colors showing the error rates for (7,4) and (15,11) hamming codes 4. A legend identifving the curves For this part, we will analyze via simulation, the effect of probability of error in a binary symmetric channel (BSC) on the bit error rate for hamming codes with different code lenghts To this end, write a python script to perform the simulation with following parameters: 1. Generate 10 message bits (random binary values (bool/int)) 2. Generate the corresponding code bits for (7,4) and (15, 11) hamming codes 3. Transmit the code bits through a BSC with e, Ye E { 10%, =-3,-2.99.-2.98. . . . ,-0.3} 4. Decode the received codebits form the output of the channel to extract the message bits 5. Compare the original message bits to the extracted ones to compute the number of errors Using the results of your simulation, generate a plot containing the following information: 1, on the x-axis 2. log1o (error rate of message bits) on the y-axis 3. Two curves with different colors showing the error rates for (7,4) and (15,11) hamming codes 4. A legend identifving the curves
Step by Step Solution
There are 3 Steps involved in it

Get step-by-step solutions from verified subject matter experts