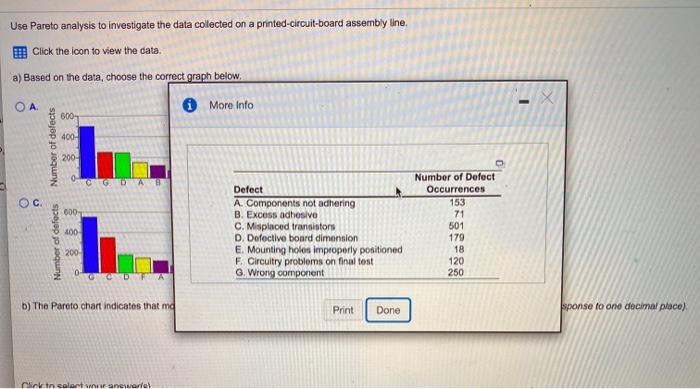
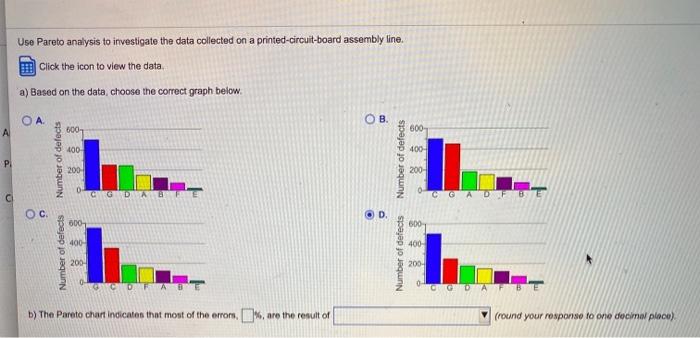
Question: Use Pareto analysis to investigate the data collected on a printed circuit-board assembly line, Click the icon to view the data. a) Based on the

Use Pareto analysis to investigate the data
Use Pareto analysis to investigate the data collected on a printed circuit-board assembly line, Click the icon to view the data. a) Based on the data, choose the correct graph below. - A * More Info 600 400- Number of defects 200- 0 TODA C. 000 100 Number of defects Number of Defect Occurrences 153 71 501 179 18 120 250 Defect A. Components not adhering B. Excess adhesivo C. Misplaced transistors D. Defective board dimension E. Mounting holes improperly positioned F. Circuitry problems on final test G. Wrong component 200 GODFA b) The Pareto chart indicates that ma Print Done sponse to one decimal place) Click tn colantu anewariel Use Pareto analysis to investigate the data collected on a printed circuit-board assembly line. Click the icon to view the data a) Based on the data choose the correct graph below. A . A 800 600 400 400- P Number of defects Number of defects 200 200- GGDA 0 CAD . 000 6001 400 400 Number of defects Number of defects 200 200- 0 OFAB AEBE b) The Pareto chart Indicates that most of the errors are the result of (round your response to one decimal place) Hlected on a printed circuit-board assembly line. h below. . 600- defects wrong component mounting holes improperly positioned misplaced transistors excess adhesive circuitry problems on final test defective board dimension components not adhering errors, %, are the result of (round your response to or DUE AT 11:59 PM NOV 26

Step by Step Solution

There are 3 Steps involved in it

1 Expert Approved Answer
Step: 1 Unlock blur-text-image
Question Has Been Solved by an Expert!

Get step-by-step solutions from verified subject matter experts

Step: 2 Unlock
Step: 3 Unlock

Students Have Also Explored These Related General Management Questions!