

Question: Use the accompanying data table to (a) draw a normal probabilityplot, (b) determine the linear correlation between the observed values and the expectedz-scores, (c) determine
Use the accompanying data table to (a) draw a normal probabilityplot, (b) determine the linear correlation between the observed values and the expectedz-scores, (c) determine the critical value in the table of critical values of the correlation coefficient to assess the normality of the data.
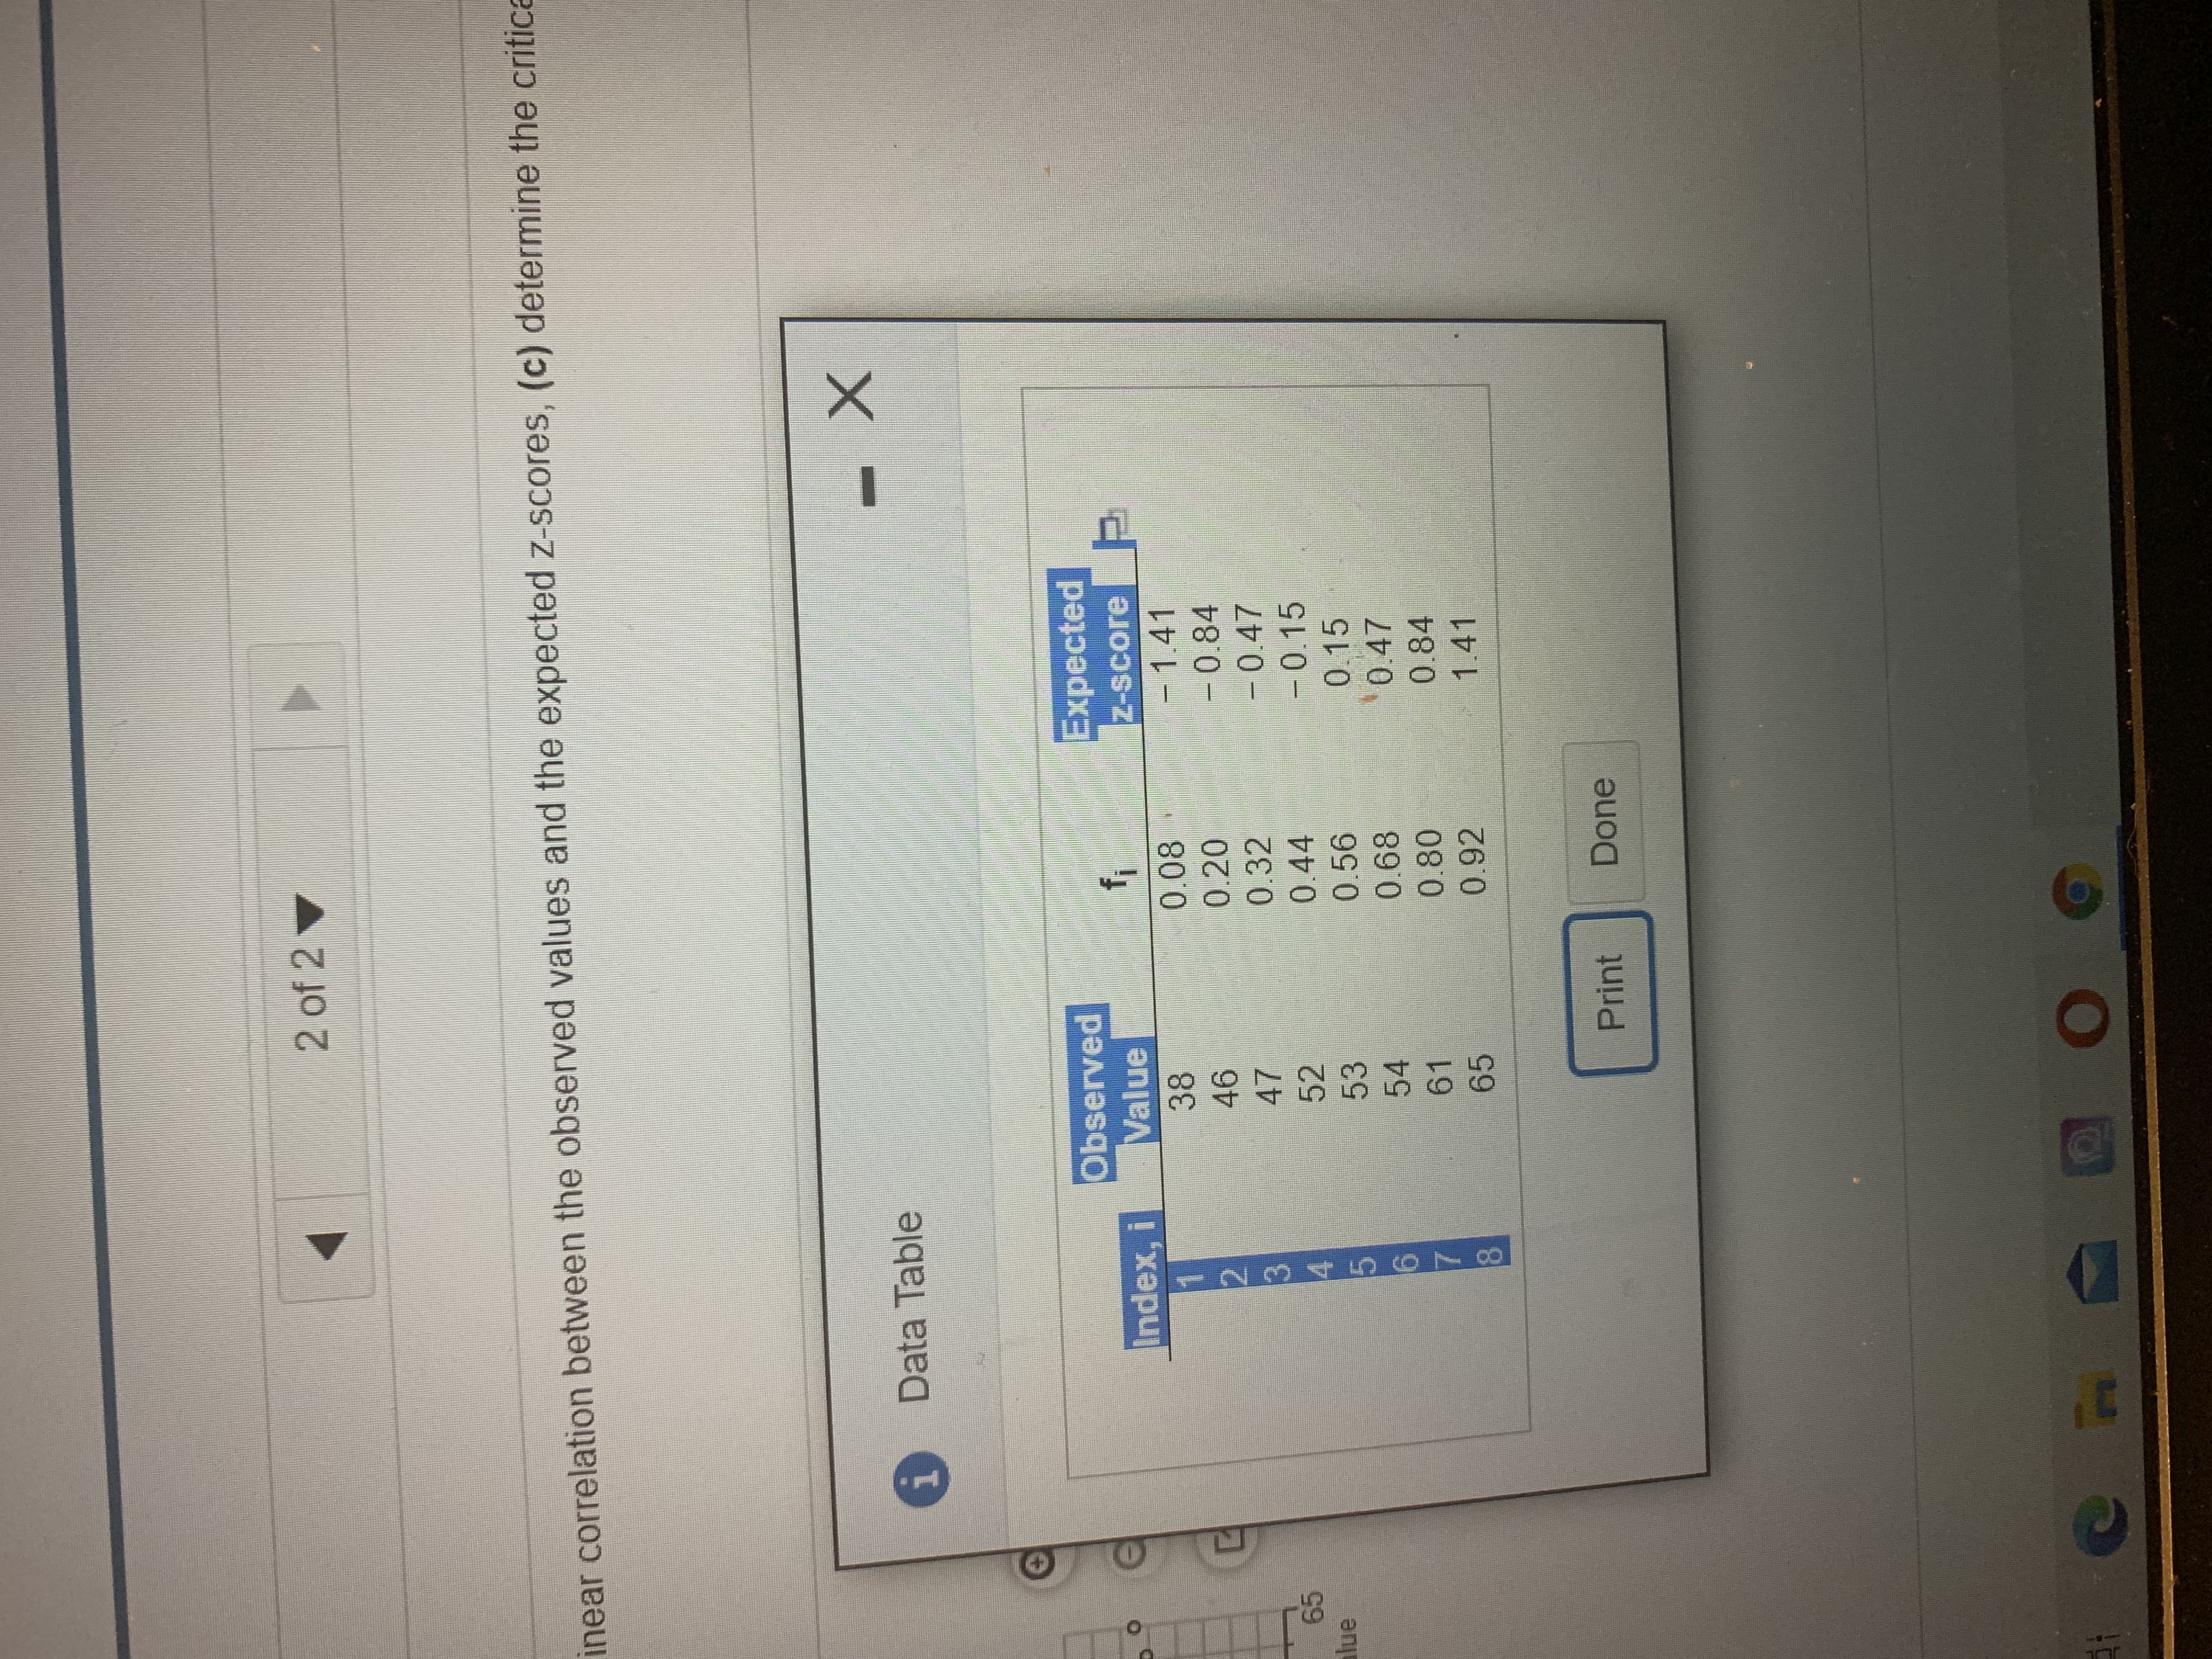
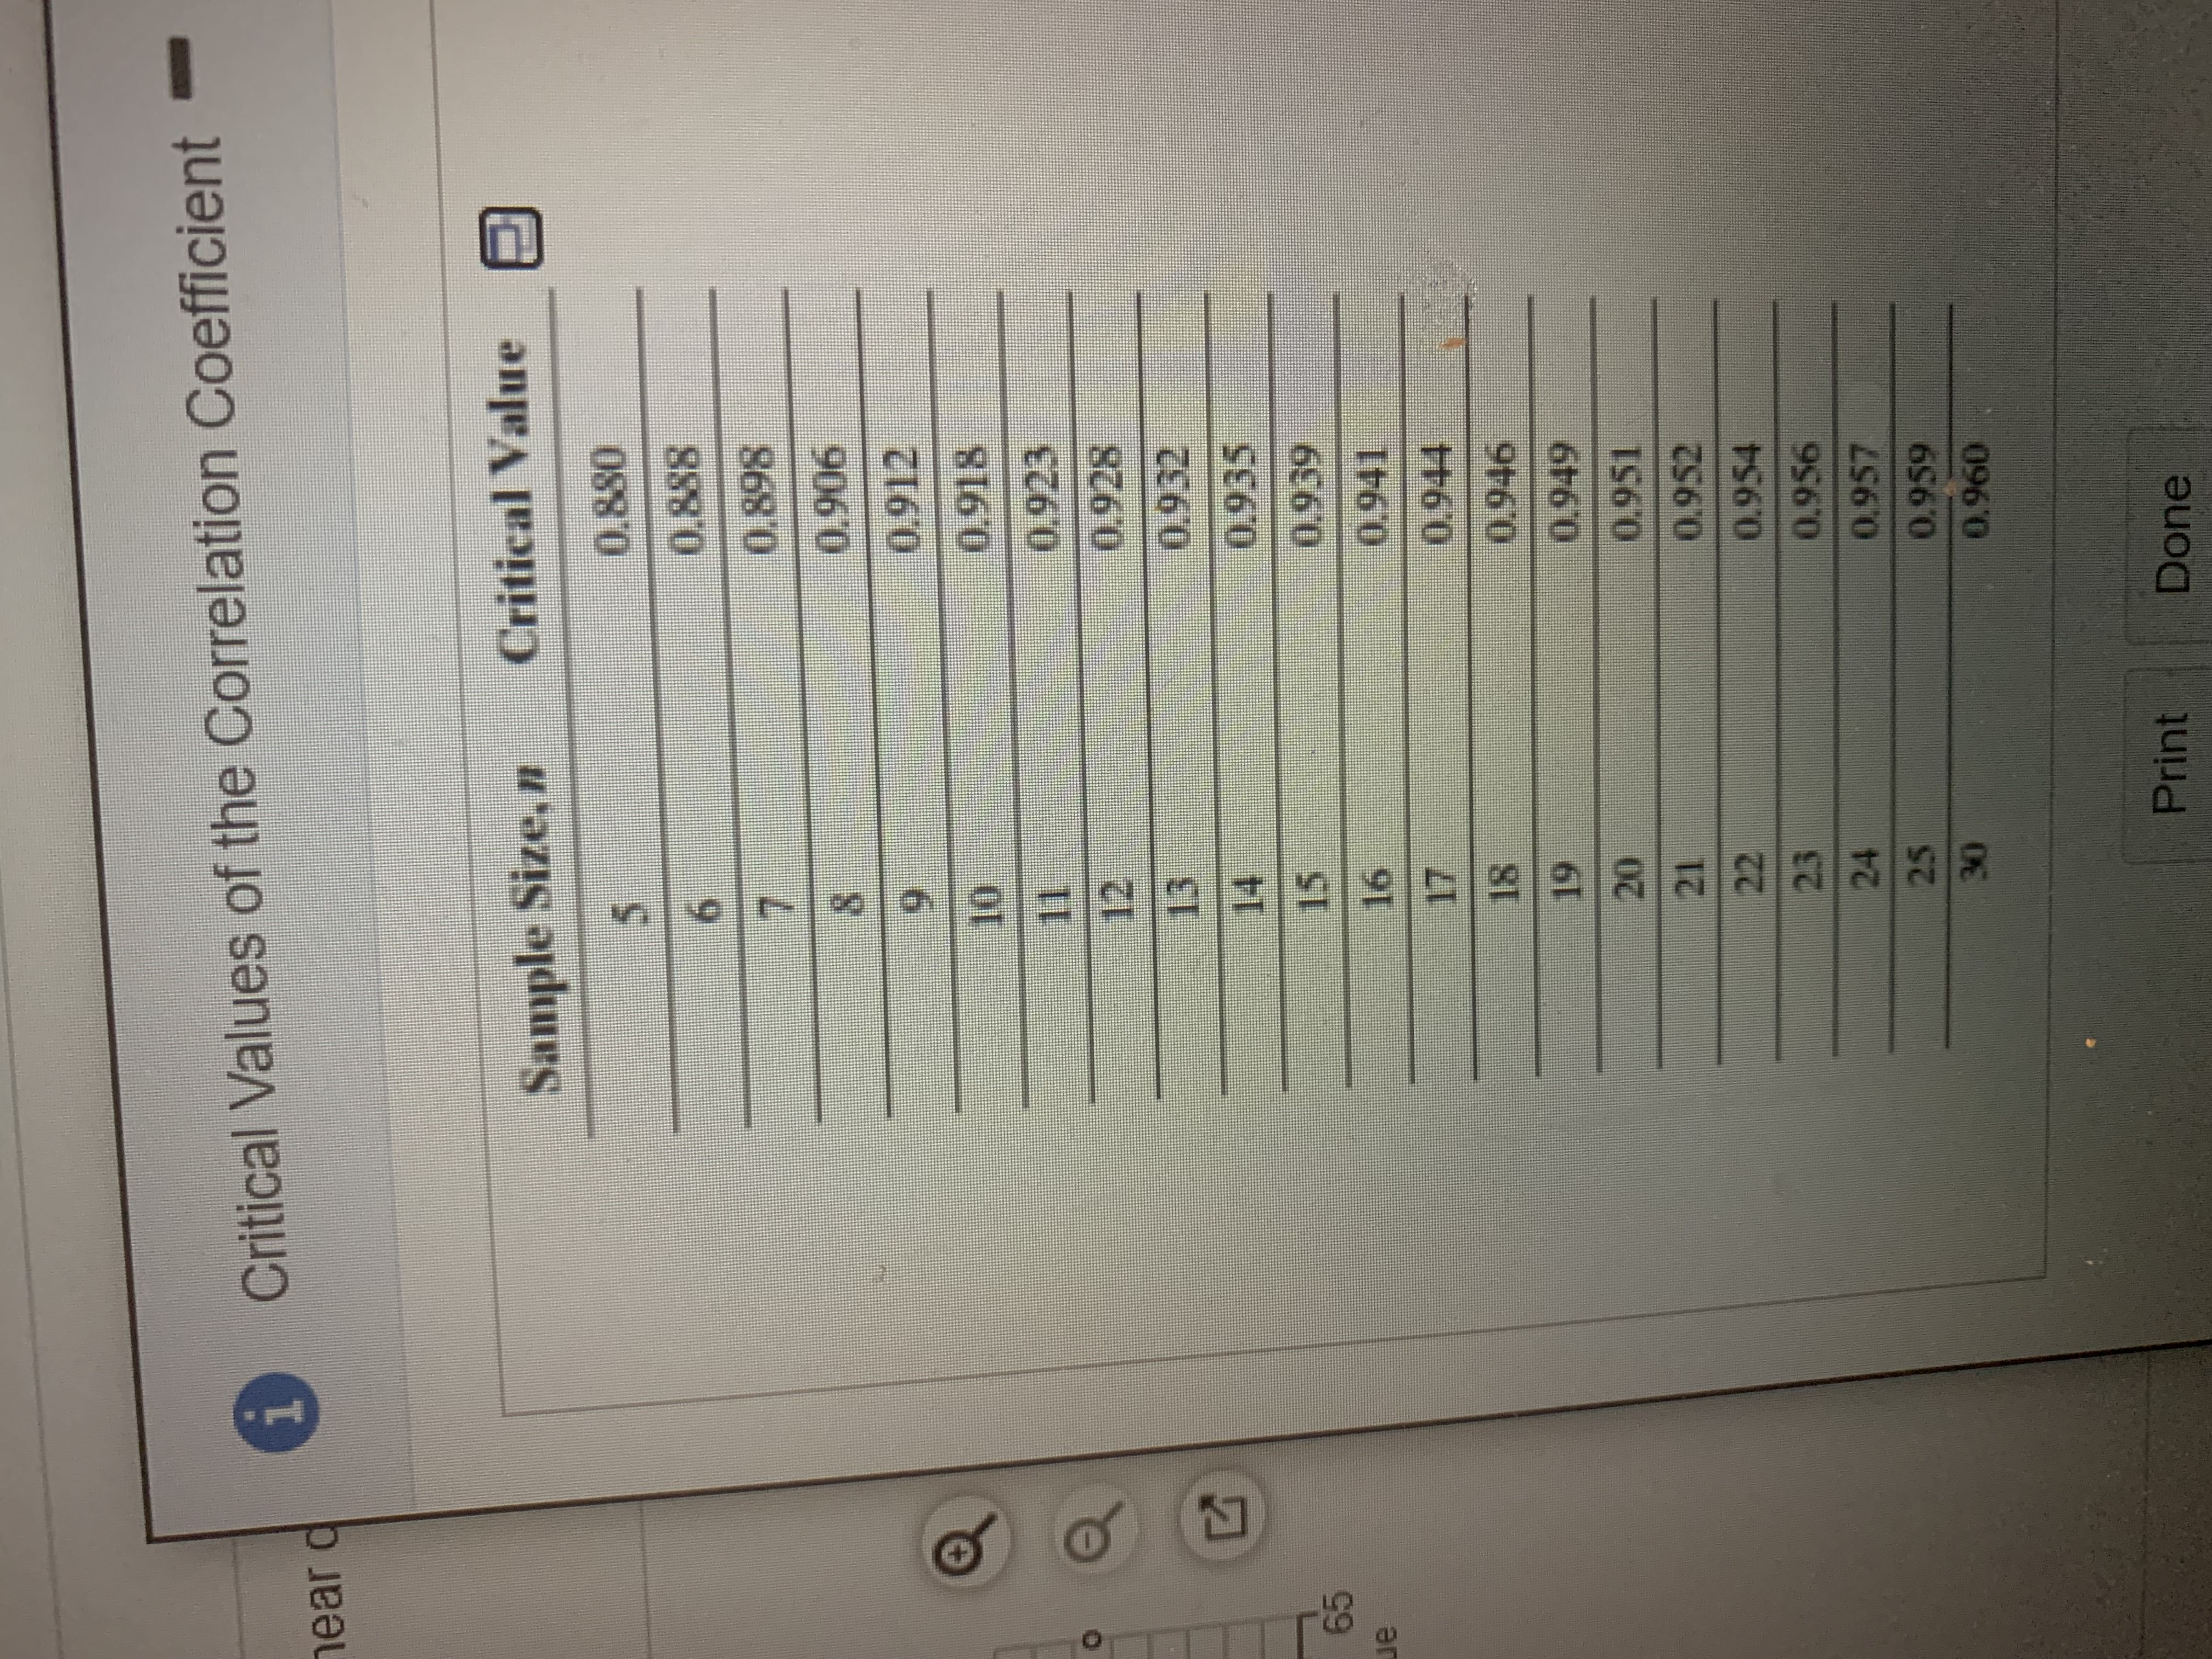
2 of 2 inear correlation between the observed values and the expected z-scores, (c) determine the critic i Data Table Observed Expected Index, i Value z-score 38 0.08 1.41 46 0.20 0.84 47 0.32 - 0.47 lue 52 0.44 - 0.15 CONOUAWN 53 0.56 0. 15 54 0.68 0.47 61 0.80 0.84 65 0.92 1.41 Print Done Oi Critical Values of the Correlation Coefficient ear c Sample Size, n Critical Value 0.880 0.838 0.898 0.906 0.912 0.918 0.923 0.928 0.932 0.935 65 0.939 0.941 0.944 0.946 0.949 0.951 0.952 22 0.954 25 0.956 0.957 0.959 0.960 Print Done
Step by Step Solution
There are 3 Steps involved in it

Get step-by-step solutions from verified subject matter experts