

Question: Use the bivariate data provided to create a scatterplot using EXCEL or R. Use your best judgement when selecting appropriate axis labels and the axis
Use the bivariate data provided to create a scatterplot using EXCEL or R. Use your best judgement when selecting appropriate axis labels and the axis scale. Provide an informative figure caption for the plot.
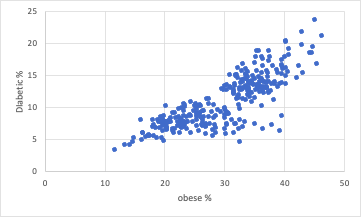
25 20 15 Diabetic % 10 in 10 20 30 40 50 obese %
Step by Step Solution
There are 3 Steps involved in it
1 Expert Approved Answer
Step: 1 Unlock

Question Has Been Solved by an Expert!
Get step-by-step solutions from verified subject matter experts
Step: 2 Unlock
Step: 3 Unlock