

Question: Use the Excel file accompanied in this assignment to answer this question. The historical data includes a product s sales for the past years. (
Use the Excel file accompanied in this assignment to answer this question. The historical data includes a products
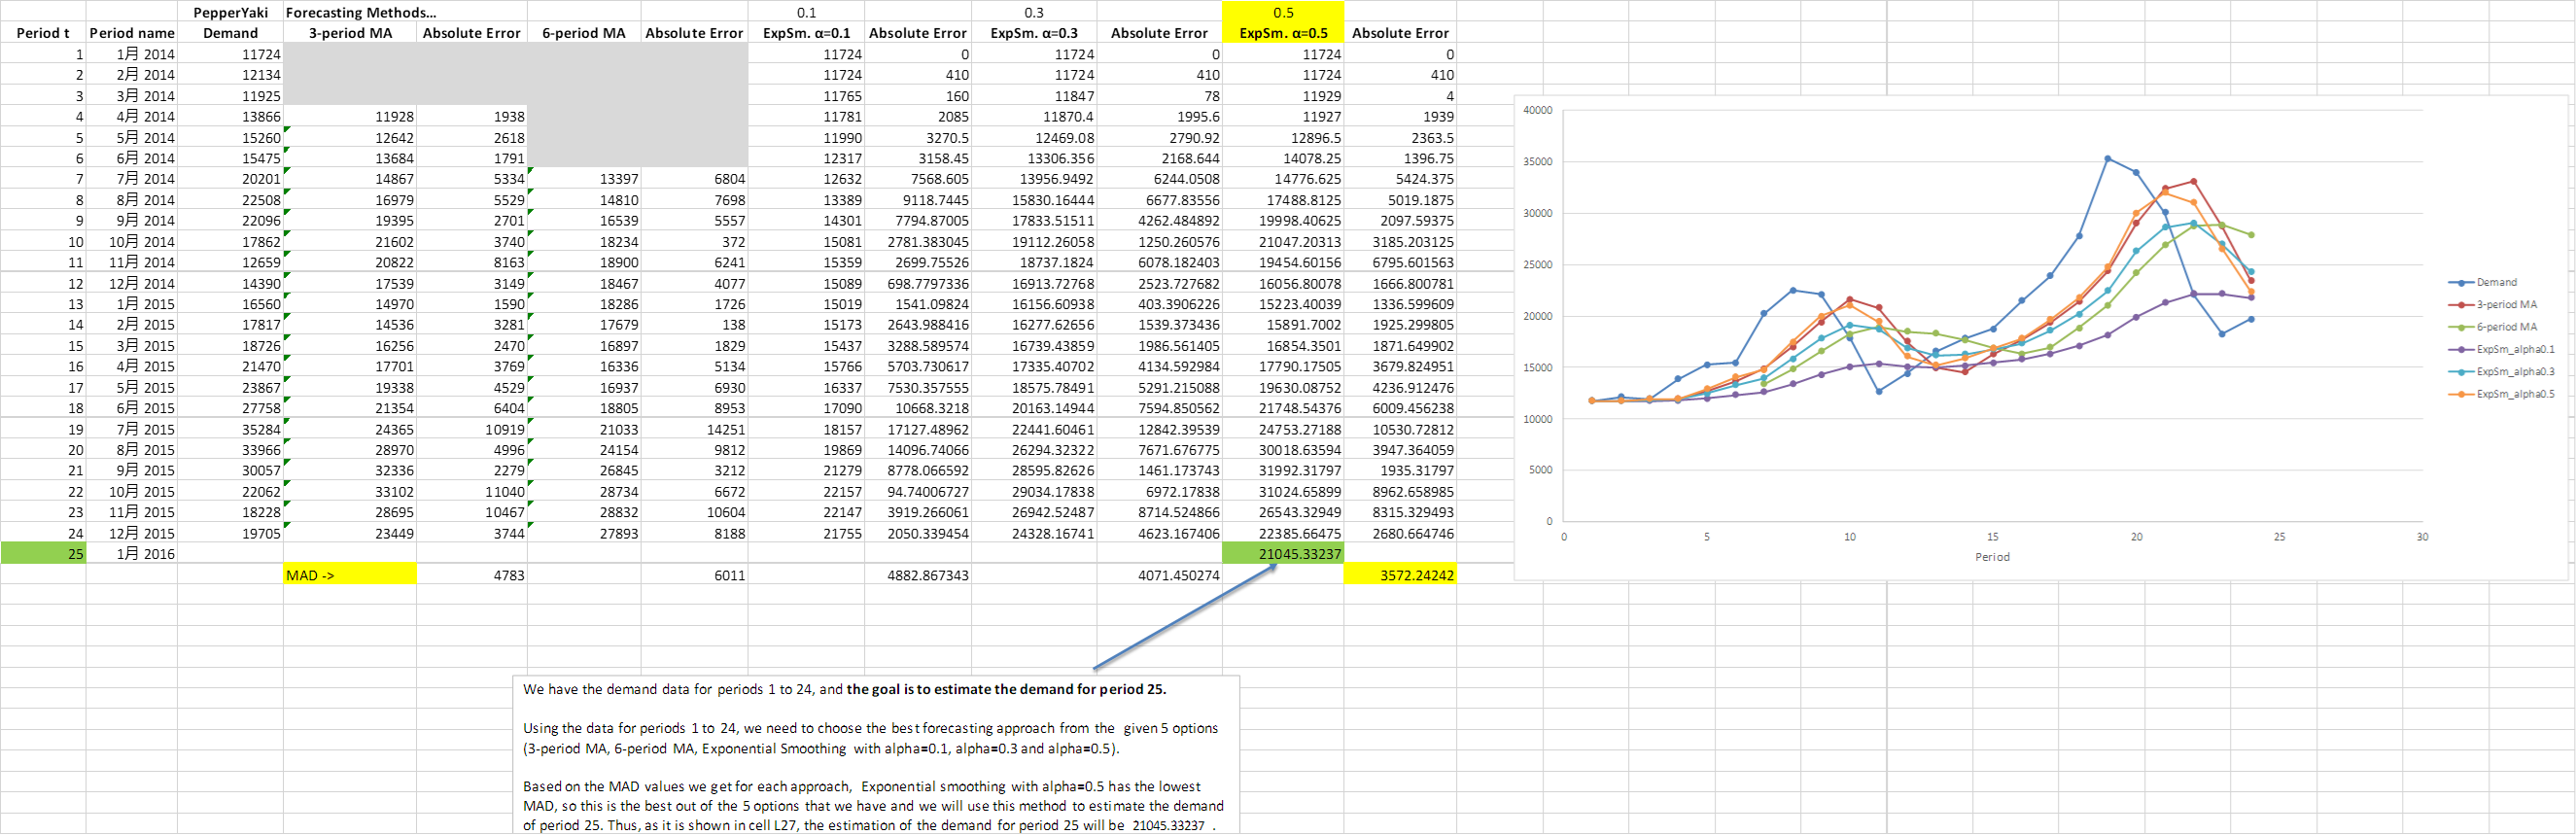
sales for the past years.
a Plot the sales data with respect to time select the two columns; then from Insert ribbon, click on Recommended
Charts and select Scatter plot; it should show demand points over time connected to one another with straight lines
Before computing the MAD for each forecasting method, and by observing the plot only, try to guess whether a
period or a period moving average method is a better forecast it is ok if your guess is not aligned with your
answer in part b as long as you provide correct reasonings for your conclusions Hint: study Week Fridays
lecture notes if you missed that lecture or dont remember the discussion around advantages of largersmaller n
values.
b Which forecast method among the following four do you recommend: period and period moving averages,
and exponential smoothing with and Justify your answer by calculating MADs in Excel. Briefly
explain read the blue paragraph above for a clearer description of what you need to submit for this question
Step by Step Solution
There are 3 Steps involved in it
1 Expert Approved Answer
Step: 1 Unlock

Question Has Been Solved by an Expert!
Get step-by-step solutions from verified subject matter experts
Step: 2 Unlock
Step: 3 Unlock