

Question: Use the frequency distributions and histograms for weekly usage and waiting time in the car sharing data provided along with the formulas shown, where fi
Use the frequency distributions and histograms for weekly usage and waiting time in the car sharing data provided along with the formulas shown, where fi is the frequency of observation i, to find the sample mean, on the left, and sample variance, on the right. Check your results using Excel functions with the original data.
| Gender | Service Used | Booking Time | Weekly Usage | Waiting Time |
| Male | Uber | Morning | 5 | 10 |
| Female | Lyft | Afternoon | 3 | 5 |
| Male | Uber | Evening | 2 | 10 |
| Male | Uber | Morning | 2 | 10 |
| Male | Uber | Evening | 2 | 15 |
| Male | Uber | Morning | 3 | 5 |
| Male | Uber | Evening | 2 | 5 |
| Male | Uber | Morning | 2 | 10 |
| Female | Uber | Morning | 3 | 10 |
| Male | Uber | Afternoon | 2 | 15 |
| Male | Lyft | Morning | 3 | 10 |
| Male | Uber | Morning | 2 | 15 |
| Female | Lyft | Morning | 2 | 20 |
| Female | Uber | Evening | 2 | 10 |
| Male | Lyft | Morning | 2 | 10 |
| Male | Uber | Night | 0 | 5 |
| Male | Uber | Morning | 1 | 10 |
| Female | Uber | Evening | 1 | 5 |
| Male | Lyft | Afternoon | 2 | 5 |
| Female | Uber | Morning | 7 | 10 |
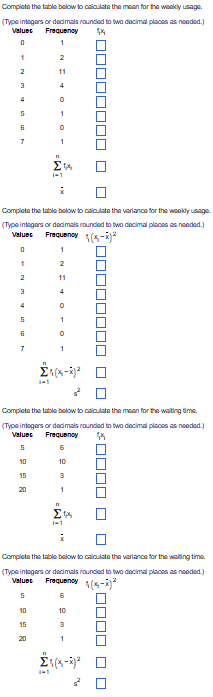
Complota the table below to ciloulate the mean for the wookly usinge. ' docimal plsoes as nondod.] Complota the table below to caloulate the veriance for the wonidy usange. Complota the table below to caloulate the mean for the wating tome. Completa the tabie below to caloulate the veriance for the waling time
Step by Step Solution
There are 3 Steps involved in it

Get step-by-step solutions from verified subject matter experts