

Question: Use the graph below to plot the lelllewing data. The top row at data will he used for the horizontal axis. Be sure to use
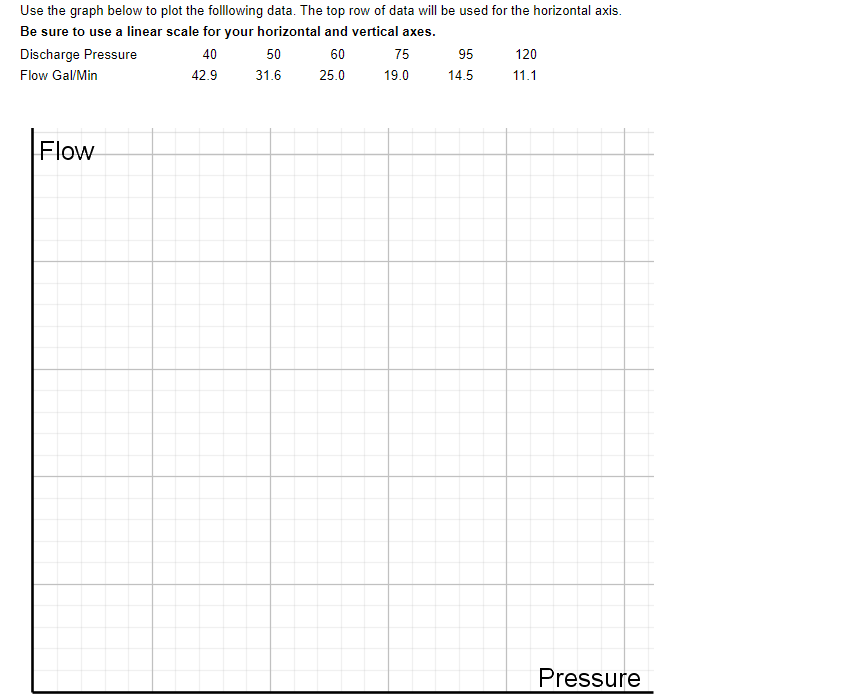
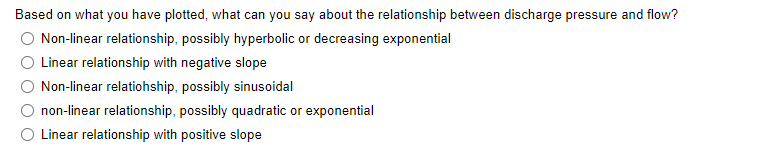
Use the graph below to plot the lelllewing data. The top row at data will he used for the horizontal axis. Be sure to use a linear scale for your horizontal and vertical axes. Discharge Pressure 40 5E] 60 ?5 '95 120 Flew Gal."Min 42.9 31 .IS 25.0 19.0 14.5 11.1 Flow Pressure Based on what you have plotted, what can you say about the relationship between discharge pressure and flow? O Non-linear relationship, possibly hyperbolic or decreasing exponential O Linear relationship with negative slope O Non-linear relationship, possibly sinusoidal O non-linear relationship, possibly quadratic or exponential O Linear relationship with positive slope
Step by Step Solution
There are 3 Steps involved in it

Get step-by-step solutions from verified subject matter experts