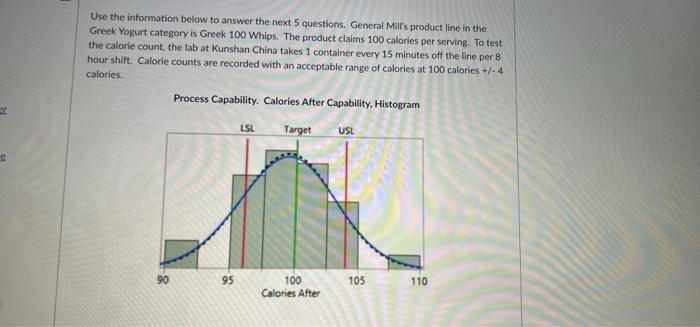
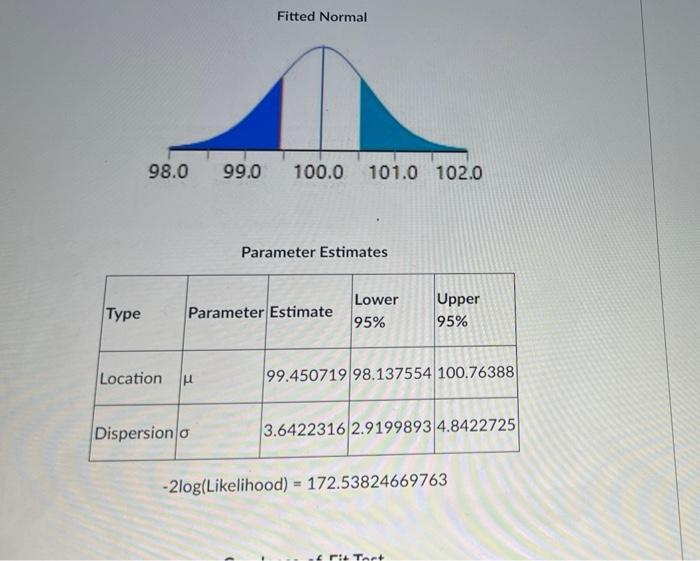
Question: Use the information below to answer the next 5 questions. General Mill's product line in the Greek Yogurt category is Greek 100 Whips. The product

Use the information below to answer the next 5
Use the information below to answer the next 5 questions. General Mill's product line in the Greek Yogurt category is Greek 100 Whips. The product claims 100 calories per serving. To test the calorie count, the lab at Kunshan China takes 1 container every 15 minutes off the line per 8 hour shift. Calorie counts are recorded with an acceptable range of calories at 100 calories +/- 4 calories. Process Capability. Calories After Capability. Histogram er LSL Target USL 90 95 105 110 100 Calories After Process Summary LSL 196 Target 100 USL 104 N 32 Mean 99.45072 Within Sigma 3.737476 Overall Sigma 3.642232 Within sigma estimated by moving range. Within Sigma Capability Lower Index Estimate 95% Upper 95% Cpk 0.308 0.157 0.459 pl 0.308 0.155 0.456 Cpu 0.406 0.231 0.575 0.357 0.245 0.468 Cpm 0.353 0.267 0.439 Nonconformance Nonconformance Portion Observed % Expected Expected Within % Overall % Below LSL 15.6250 17.7932 17.1713 Above USL 9.3750 11.1763 10.5826 Total Outside 25.0000 28.9695 27.7539 Calories After Total 25.0000 Outside 28.9695 27.7539 Calories After 90 95 100 105 110 Quantiles Quantiles Normal (99.4507,3.64223) 100.0% maximum 109.173 99.5% 109.173 97.5% 109.173 90.0% 103.6265 75.0% quartile 102.04825 50.0% median 99.5215 25.0% quartile 96.859 10.0% 95.602 2.5% 91.572 0.5% 91.572 0.0% minimum 91.572 Summary Statistics Mean 99.450719 Std Dev 3,6422316 Std Err Mean 10.6438617 Upper 95% Mean 100.76388 Lower 95% Mean 98.137554 N 32 Maan Test Mean Hypothesized Value 100 Actual Estimate 99.4507 DF 31 Std Dev 3.64223 t Test Test Statistic -0.8531 Prob > t 0.4001 Prob >t 0.7999 Prob

Step by Step Solution

There are 3 Steps involved in it

1 Expert Approved Answer
Step: 1 Unlock blur-text-image
Question Has Been Solved by an Expert!

Get step-by-step solutions from verified subject matter experts

Step: 2 Unlock
Step: 3 Unlock

Students Have Also Explored These Related General Management Questions!