

Question: Use the information provided in the Table 1 and the network diagram in Figure 1 for the following problems. Activity Normal Time(weeks) Normal Cost ($)
Use the information provided in the Table 1 and the network diagram in Figure 1 for the following problems.
| Activity | Normal Time(weeks) | Normal Cost ($) | Crash Time (weeks) | Crash Cost ($) | Maximum weeks Reduced | Crash Cost per Week ($) |
| A | 4 | 550 | 3 | 950 | 2 | 450 |
| B | 5 | 650 | 4 | 750 | 2 | 150 |
| C | 7 | 850 | 4 | 1350 | 4 | 550 |
| D | 7 | 1550 | 5 | 2200 | 3 | 100 |
| E | 7 | 1800 | 5 | 2300 | 3 | 550 |
| F | 6 | 250 | 6 | 1250 | 1 | 1050 |
| G | 8 | 1550 | 6 | 1850 | 3 | 350 |
Table 1
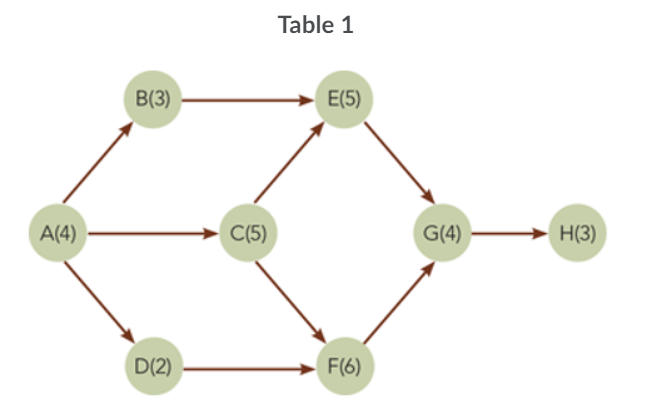
Figure 1. AON network diagram
- Using the information given,
- Calculate the completion time of the project.
- Identify the activities on the critical path.
- Using the information given and the project completion time calculated in Problem 1, reduce the completion time of the project 3 weeks in the most economical way.
- Using the information given and the project completion time calculated in Problem 1, calculate the minimum time for completing the project possible.
UPDATE: Activity H is simply the last activity on the diagram. I am told you don't need it to actually compute anything or create formulas, but it's needed when counting the number of weeks.
Table 1 B(3) E(5) A(4) C(5) G(4) H(3) D(2) F(6)Step by Step Solution
There are 3 Steps involved in it
1 Expert Approved Answer
Step: 1 Unlock

Question Has Been Solved by an Expert!
Get step-by-step solutions from verified subject matter experts
Step: 2 Unlock
Step: 3 Unlock