

Question: Use the spreadsheet you have above, create a data table in which the input variable to be changed is demand and show the resulting profit.
Use the spreadsheet you have above, create a data table in which the input variable to be changed is demand and show the resulting profit. The values for demand are:
Demand Profit
30,000 ???
35,000 ???
40,000 ???
45,000 ???
50,000 ???
55,000 ???
60,000 ???
65,000 ???
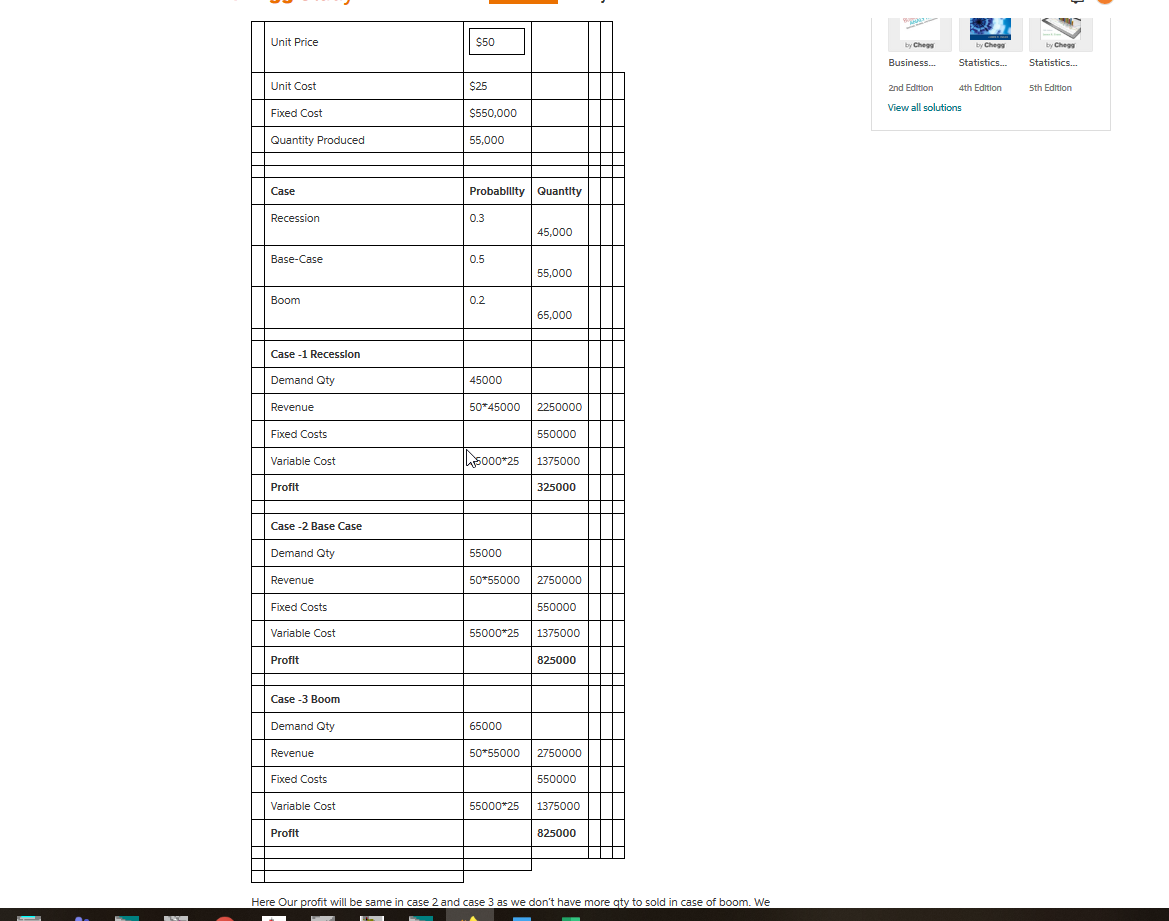
Unit Price $50 by Chega by Choo by Chega Business... Statistics... Statistics... Unit Cost $25 2nd Edition 4th Edition 5th Edition View all solutions Fixed Cost $550,000 Quantity Produced 55,000 Case Probability Quantity Recession 0.3 45,000 Base-Case 0.5 55,000 Boom 0.2 65,000 Case -1 Recession Demand Qty 45000 Revenue 50*45000 2250000 Fixed Costs 550000 Variable Cost Th15000*25 1375000 Profit 325000 Case-2 Base Case Demand Qty 55000 Revenue 50*55000 2750000 Fixed Costs 550000 Variable Cost 55000*25 1375000 Profit 825000 Case-3 Boom Demand Qty 65000 Revenue 50*55000 2750000 Fixed Costs 550000 Variable Cost 55000*25 1375000 Profit 825000 Here Our profit will be same in case 2 and case 3 as we don't have more aty to sold in case of boom. We E 1Step by Step Solution
There are 3 Steps involved in it
1 Expert Approved Answer
Step: 1 Unlock

Question Has Been Solved by an Expert!
Get step-by-step solutions from verified subject matter experts
Step: 2 Unlock
Step: 3 Unlock