

Use the SPSS output below for the following five questions (questions 33, 34, 35, 36, and 37).
Question:
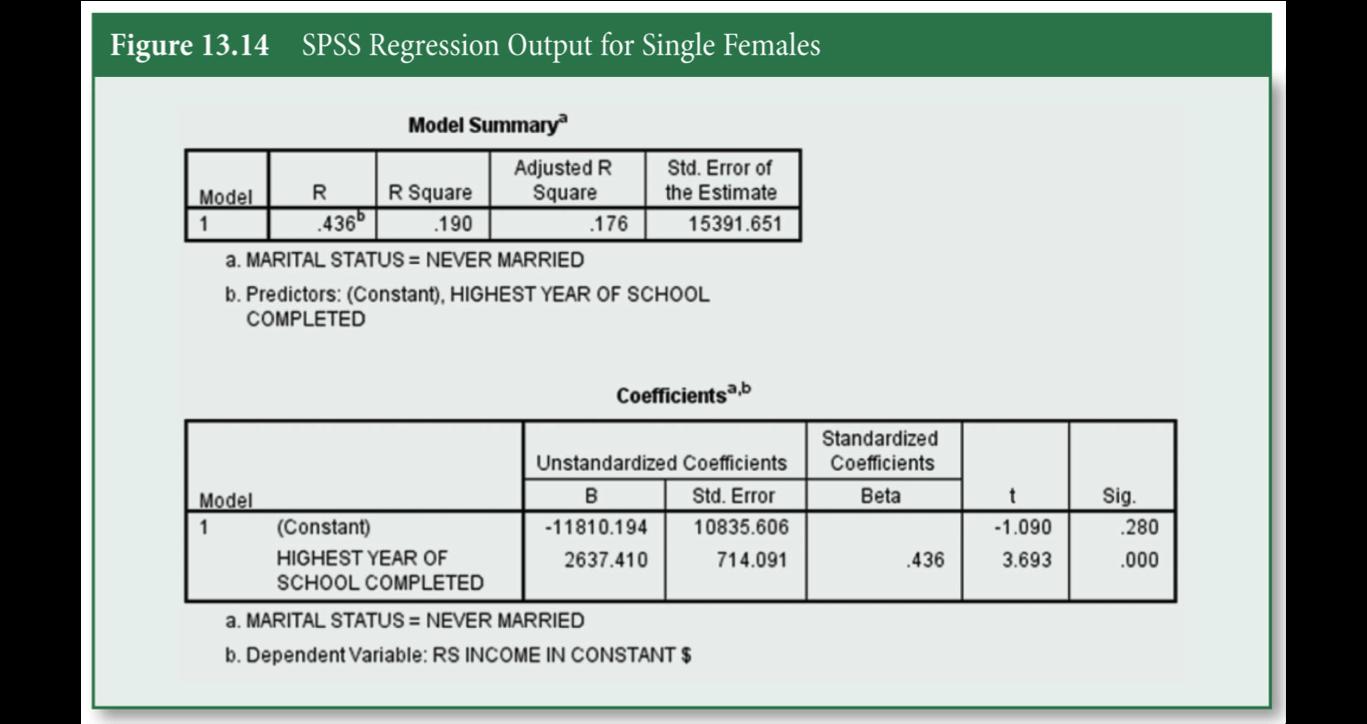
Use the SPSS output below for the following five questions (questions 33, 34, 35, 36, and 37). The regression output is of the income (DV) of full-time employed single women based on completed years of education.
33.What is the strength of the association based on the value of r?
A.No association
B.Weak positive association
C.Moderate positive association
D.Strong positive association
34.Interpret the value of r2 (e.g. what is the significance of this value in the regression output):
A.Level of education perfectly predicts income for single women.
B.Level of education moderately predicts income for single women.
C.The model explains 19% of the variation in the independent variable.
D.The model explains 19% of the variation in the dependent variable.
35.Interpret the 2,637.410 coefficient for education (e.g. what does this value represent):
A.With 0 years of education, a single woman would earn $2,637.41.
B.The highest year of school completed decreases single women's income by $2,637.41.
C.For each additional year of education, single women's income increases by $2,637. 41.
D.None of the above.
36.Using the values from the SPSS output above, write out the regression equation in the standard format (e.g. y = a + bx):
37.How much money would you expect a single woman with 15 years of education to make? $___________
NOTE: Round to the nearest whole dollar. DO NOT use a dollar sign nor a comma. (E.g. 19382)
Expert Answer:


Stats Data and Models
ISBN: 978-0321986498
4th edition
Authors: Richard D. De Veaux, Paul D. Velleman, David E. Bock
