

Question: The output below is from a multiple linear regression analysis done by an area realty group. The analysis is intended to link y, the time
The output below is from a multiple linear regression analysis done by an area realty group. The analysis is intended to link y, the time that a house listed for sale remains on the market, to the size of the house (x1), the listing price (x2), and the age of the house (x3).
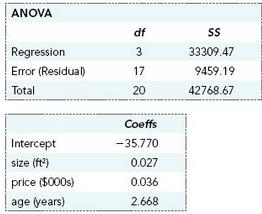
a. Identify and interpret the estimated regression coefficients for x1, x2, and x3.
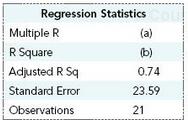
b. Fill in the values of Multiple R and R Square.
Regression Statistics Multiple R R Square Adjusted RSq Standard Error Observations b) 0.74 23.59 21 ANOVA Regression Error (Residual) Total 2 33309.47 9459.19 42768.67 Intercept size (ft price (5000s) age years) Coeffs -35.770 0027 0.036 2.668
Step by Step Solution
3.38 Rating (164 Votes )
There are 3 Steps involved in it
a The coefficient for x 1 size is 027 indicating that if price x 2 and age x 3 are h... View full answer

Get step-by-step solutions from verified subject matter experts
Document Format (1 attachment)
486-M-S-L-R (3057).docx
120 KBs Word File