

Question: Use the subplot command to break the MATLAB figure window into a 2x2 grid of sub-windows. Then plot the following functions using MATLAB commands for
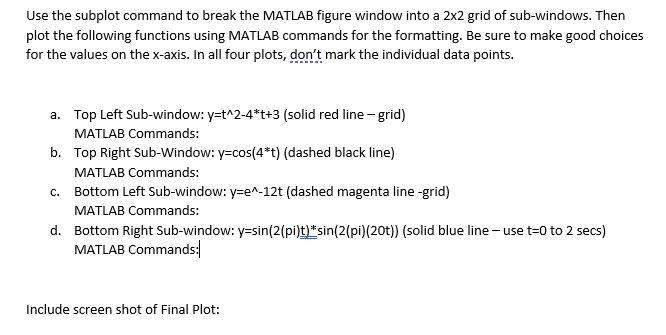
Use the subplot command to break the MATLAB figure window into a 2x2 grid of sub-windows. Then plot the following functions using MATLAB commands for the formatting. Be sure to make good choices for the values on the x-axis. In all four plots, don't mark the individual data points. a. Top Left Sub-window:y=t^2-4*t+3 (solid red line-grid) MATLAB Commands: b. Top Right Sub-Window:y=cos(4*t) (dashed black line) MATLAB Commands: Bottom Left Sub-window:y=e^-12t (dashed magenta line-grid) MATLAB Commands: d. Bottom Right Sub-window: y=sin(2 2(pi) (2 (solid blue line MATLAB Commands: C. se t=0 to 2 secs) Include screen shot of Final Plot
Step by Step Solution
There are 3 Steps involved in it
1 Expert Approved Answer
Step: 1 Unlock

Question Has Been Solved by an Expert!
Get step-by-step solutions from verified subject matter experts
Step: 2 Unlock
Step: 3 Unlock