

Question: Use the test results in Table 16-4 Weekly Unit Sales of Betty Spaghetty in Test and Control Cities on page 199 (maybe a different page
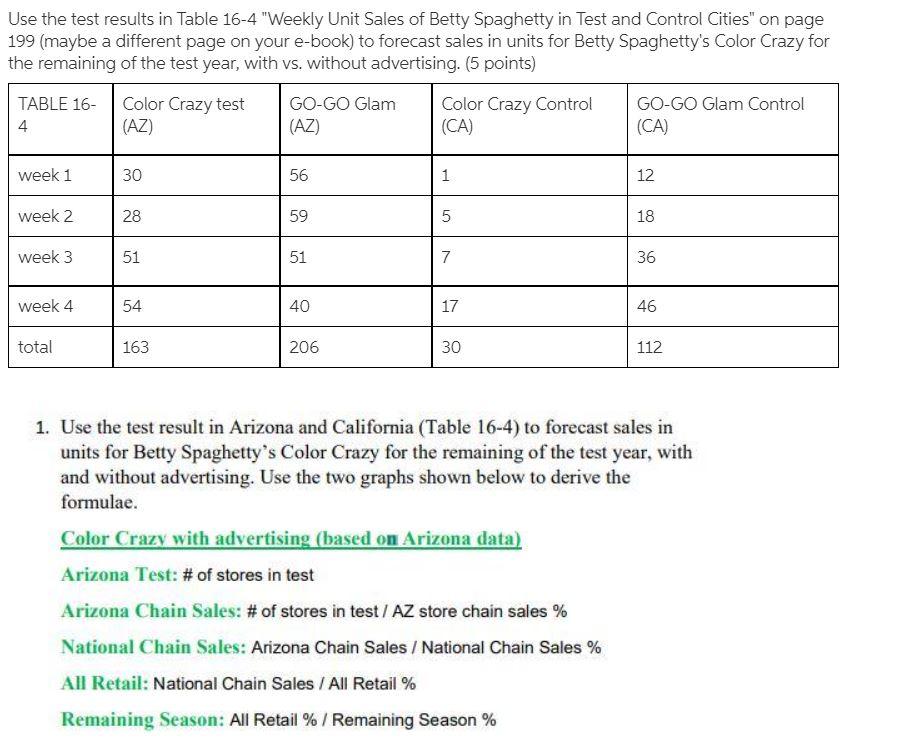
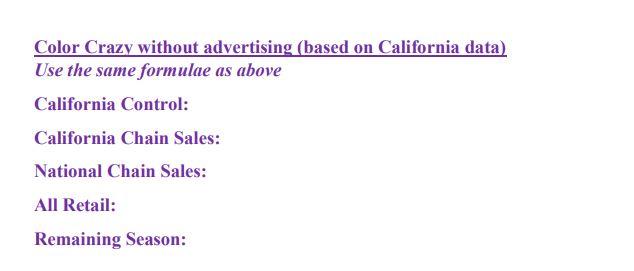
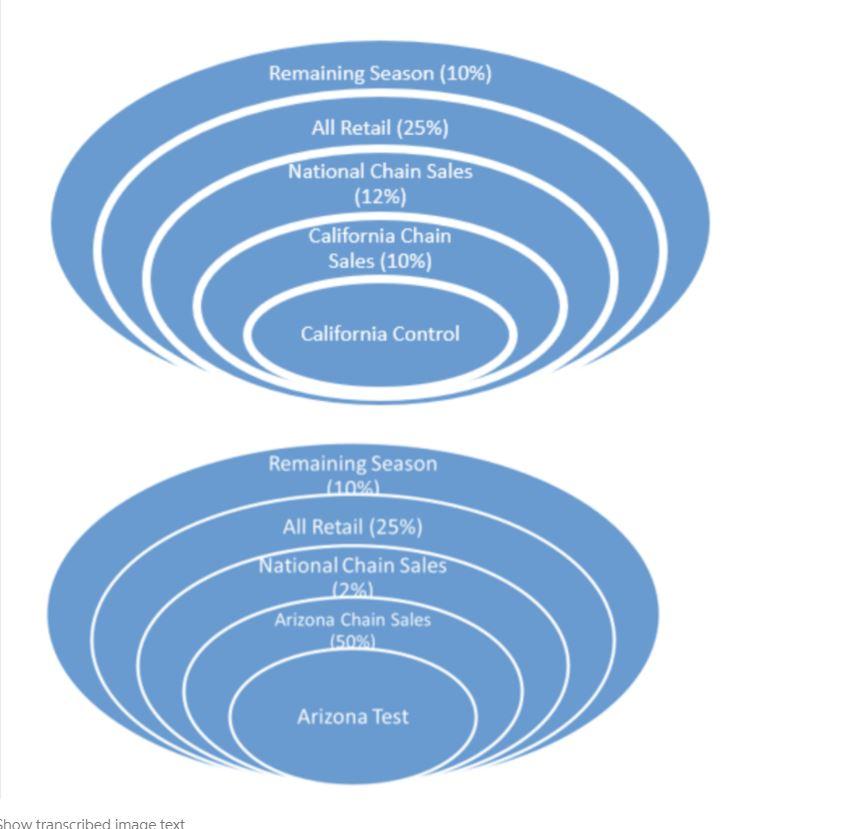
Use the test results in Table 16-4 "Weekly Unit Sales of Betty Spaghetty in Test and Control Cities" on page 199 (maybe a different page on your e-book) to forecast sales in units for Betty Spaghetty's Color Crazy for the remaining of the test year, with vs. without advertising. (5 points) TABLE 16- 4 Color Crazy test (AZ) GO-GO Glam (AZ) Color Crazy Control (CA) GO-GO Glam Control (CA) week 1 30 56 1 12 week 2 28 59 5 18 week 3 51 51 7 36 week 4 54 40 17 46 total 163 206 30 112 1. Use the test result in Arizona and California (Table 16-4) to forecast sales in units for Betty Spaghetty's Color Crazy for the remaining of the test year, with and without advertising. Use the two graphs shown below to derive the formulae. Color Crazy with advertising (based on Arizona data) Arizona Test: # of stores in test Arizona Chain Sales: # of stores in test / AZ store chain sales % National Chain Sales: Arizona Chain Sales / National Chain Sales % All Retail: National Chain Sales / All Retail % Remaining Season: All Retail % / Remaining Season % Color Crazy without advertising (based on California data) Use the same formulae as above California Control: California Chain Sales: National Chain Sales: All Retail: Remaining Season: Remaining Season (10%) All Retail (25%) National Chain Sales (12%) California Chain Sales (10%) California Control Remaining Season (10%) All Retail (25%) () National Chain Sales (29 Arizona Chain Sales (50%) Arizona Test Show transcribed image text Use the test results in Table 16-4 "Weekly Unit Sales of Betty Spaghetty in Test and Control Cities" on page 199 (maybe a different page on your e-book) to forecast sales in units for Betty Spaghetty's Color Crazy for the remaining of the test year, with vs. without advertising. (5 points) TABLE 16- 4 Color Crazy test (AZ) GO-GO Glam (AZ) Color Crazy Control (CA) GO-GO Glam Control (CA) week 1 30 56 1 12 week 2 28 59 5 18 week 3 51 51 7 36 week 4 54 40 17 46 total 163 206 30 112 1. Use the test result in Arizona and California (Table 16-4) to forecast sales in units for Betty Spaghetty's Color Crazy for the remaining of the test year, with and without advertising. Use the two graphs shown below to derive the formulae. Color Crazy with advertising (based on Arizona data) Arizona Test: # of stores in test Arizona Chain Sales: # of stores in test / AZ store chain sales % National Chain Sales: Arizona Chain Sales / National Chain Sales % All Retail: National Chain Sales / All Retail % Remaining Season: All Retail % / Remaining Season % Color Crazy without advertising (based on California data) Use the same formulae as above California Control: California Chain Sales: National Chain Sales: All Retail: Remaining Season: Remaining Season (10%) All Retail (25%) National Chain Sales (12%) California Chain Sales (10%) California Control Remaining Season (10%) All Retail (25%) () National Chain Sales (29 Arizona Chain Sales (50%) Arizona Test Show transcribed image text
Step by Step Solution
There are 3 Steps involved in it
1 Expert Approved Answer
Step: 1 Unlock

Question Has Been Solved by an Expert!
Get step-by-step solutions from verified subject matter experts
Step: 2 Unlock
Step: 3 Unlock