

Question: Use the Variance Covariance matrix in: Efficient Portfolios Data . Construct a model to determine the following: Calculate an envelope portfolio assuming the risk-free rate
- Use the Variance Covariance matrix in: Efficient Portfolios Data.
Construct a model to determine the following:
- Calculate an envelope portfolio assuming the risk-free rate is 3%.
- Calculate an envelope portfolio assuming the risk-free rate is 20%.
- Create a one-way data table that determines the different means and standard deviations for combinations of Envelope Portfolio 1 and Envelope Portfolio 2 by varying the proportion of Portfolio 1 from -5 to +5 in increments of 0.50.
- Graph the combinations of the portfolios from the one-way data table and add the individual asset means and standard deviations to the graph.
- Provide a title on the graph and label the axes of the graph.
- Using EXCELs Text Box feature, explain whether the portfolio combinations could be on the efficient frontier.
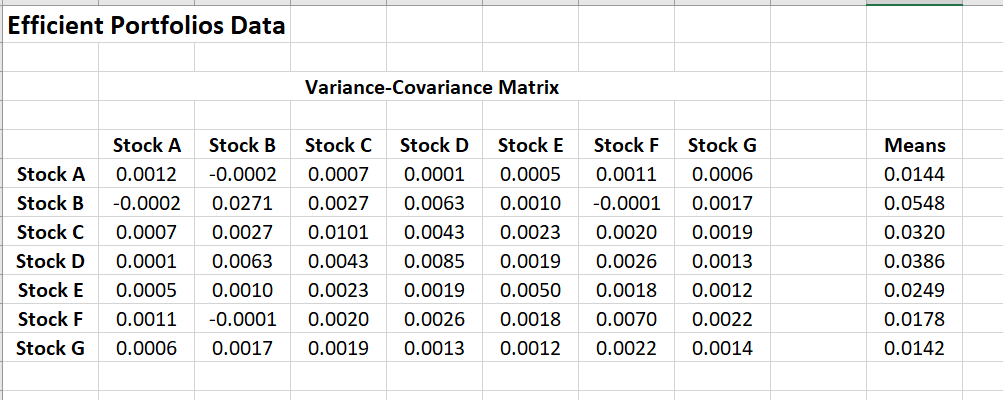
Efficient Portfolios Data Variance-Covariance Matrix Stock A Stock B Stock C Stock D Stock E Stock F Stock G Stock A 0.0012 -0.0002 0.0007 0.0001 0.0005 0.0011 0.0006 Stock B -0.0002 0.0271 0.0027 0.0063 0.0010 -0.0001 0.0017 Stock C 0.0007 0.0027 0.0101 0.0043 0.0023 0.0020 0.0019 Stock 0.0001 0.0063 0.0043 0.0085 0.0019 0.0026 0.0013 Stock E 0.0005 0.0010 0.0023 0.0019 0.0050 0.0018 0.0012 Stock F 0.0011 -0.0001 0.0020 0.0026 0.0018 0.0070 0.0022 Stock G 0.0006 0.0017 0.0019 0.0013 0.0012 0.0022 0.0014 Means 0.0144 0.0548 0.0320 0.0386 0.0249 0.0178 0.0142 Efficient Portfolios Data Variance-Covariance Matrix Stock A Stock B Stock C Stock D Stock E Stock F Stock G Stock A 0.0012 -0.0002 0.0007 0.0001 0.0005 0.0011 0.0006 Stock B -0.0002 0.0271 0.0027 0.0063 0.0010 -0.0001 0.0017 Stock C 0.0007 0.0027 0.0101 0.0043 0.0023 0.0020 0.0019 Stock 0.0001 0.0063 0.0043 0.0085 0.0019 0.0026 0.0013 Stock E 0.0005 0.0010 0.0023 0.0019 0.0050 0.0018 0.0012 Stock F 0.0011 -0.0001 0.0020 0.0026 0.0018 0.0070 0.0022 Stock G 0.0006 0.0017 0.0019 0.0013 0.0012 0.0022 0.0014 Means 0.0144 0.0548 0.0320 0.0386 0.0249 0.0178 0.0142
Step by Step Solution
There are 3 Steps involved in it

Get step-by-step solutions from verified subject matter experts