

Question: 3. Use the Variance - Covariance matrix in the Excel file: Efficient Portfolios Data. Construct a model to determine the following: a. Calculate an envelope
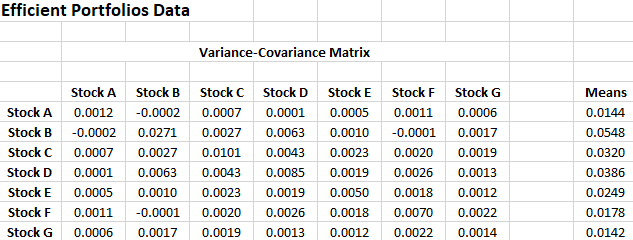
3. Use the Variance - Covariance matrix in the Excel file: Efficient Portfolios Data. Construct a model to determine the following: a. Calculate an envelope portfolio assuming the risk-free rate is 3%. b. Calculate an envelope portfolio assuming the risk-free rate is 20%. c. Create a one-way data table that determines the different means and standard deviations for combinations of Envelope Portfolio 1 and Envelope Portfolio 2 by varying the proportion of Portfolio 1 from -5 to +5 in increments of 0.50. d. Graph the combinations of the portfolios from the one-way data table and add the individual asset means and standard deviations to the graph. e. Provide a title on the graph and label the axes of the graph. f. Using EXCEL's Text Box feature, explain whether the portfolio combinations could be on the efficient frontier. Efficient Portfolios Data Variance-Covariance Matrix Stock A Stock A 0.0012 Stock B -0.0002 Stock c 0.0007 Stock D 0.0001 Stock E 0.0005 Stock F 0.0011 Stock G 0.0006 Stock B Stock C Stock D Stock E -0.0002 0.0007 0.0001 0.0005 0.0271 0.0027 0.0063 0.0010 0.0027 0.0101 0.0043 0.0023 0.0063 0.0043 0.0085 0.0019 0.0010 0.0023 0.0019 0.0050 -0.0001 0.0020 0.0026 0.0018 0.0017 0.0019 0.0013 0.0012 Stock F 0.0011 -0.0001 0.0020 0.0026 0.0018 0.0070 0.0022 Stock 0.0006 0.0017 0.0019 0.0013 0.0012 0.0022 0.0014 Means 0.0144 0.0548 0.0320 0.0386 0.0249 0.0178 0.0142 3. Use the Variance - Covariance matrix in the Excel file: Efficient Portfolios Data. Construct a model to determine the following: a. Calculate an envelope portfolio assuming the risk-free rate is 3%. b. Calculate an envelope portfolio assuming the risk-free rate is 20%. c. Create a one-way data table that determines the different means and standard deviations for combinations of Envelope Portfolio 1 and Envelope Portfolio 2 by varying the proportion of Portfolio 1 from -5 to +5 in increments of 0.50. d. Graph the combinations of the portfolios from the one-way data table and add the individual asset means and standard deviations to the graph. e. Provide a title on the graph and label the axes of the graph. f. Using EXCEL's Text Box feature, explain whether the portfolio combinations could be on the efficient frontier. Efficient Portfolios Data Variance-Covariance Matrix Stock A Stock A 0.0012 Stock B -0.0002 Stock c 0.0007 Stock D 0.0001 Stock E 0.0005 Stock F 0.0011 Stock G 0.0006 Stock B Stock C Stock D Stock E -0.0002 0.0007 0.0001 0.0005 0.0271 0.0027 0.0063 0.0010 0.0027 0.0101 0.0043 0.0023 0.0063 0.0043 0.0085 0.0019 0.0010 0.0023 0.0019 0.0050 -0.0001 0.0020 0.0026 0.0018 0.0017 0.0019 0.0013 0.0012 Stock F 0.0011 -0.0001 0.0020 0.0026 0.0018 0.0070 0.0022 Stock 0.0006 0.0017 0.0019 0.0013 0.0012 0.0022 0.0014 Means 0.0144 0.0548 0.0320 0.0386 0.0249 0.0178 0.0142
Step by Step Solution
There are 3 Steps involved in it

Get step-by-step solutions from verified subject matter experts