

Question: Using a chart to calculate the standard deviation helps to keep the numbers organized Drag and drop the values to complete the chart x mean

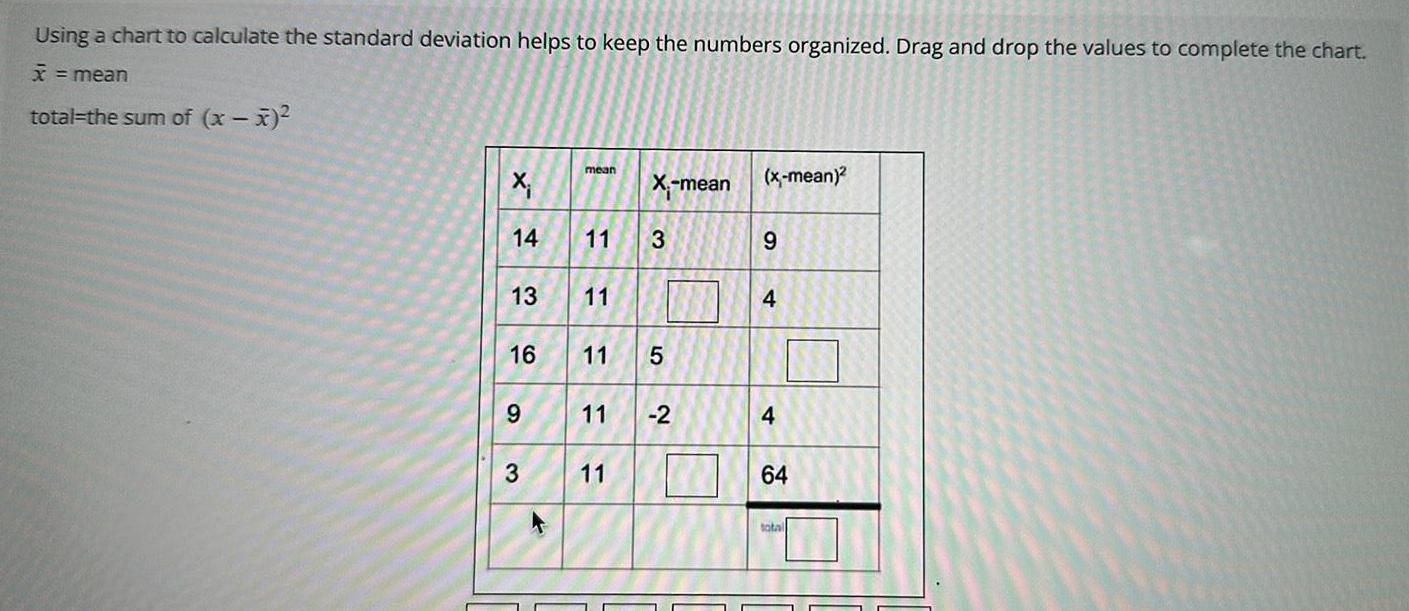
Using a chart to calculate the standard deviation helps to keep the numbers organized Drag and drop the values to complete the chart x mean total the sum of x x X 14 13 16 9 3 mean 11 11 11 11 11 X mean x mean 32 5 2 9 4 4 64 total
Step by Step Solution
There are 3 Steps involved in it
1 Expert Approved Answer
Step: 1 Unlock

Question Has Been Solved by an Expert!
Get step-by-step solutions from verified subject matter experts
Step: 2 Unlock
Step: 3 Unlock