

Question: using GLOBE telecommunication in the philippines Exercise 2: Practice evaluating the five forces, using the strategy tools presented in this chapter. 1. Use either an
using GLOBE telecommunication in the philippines 
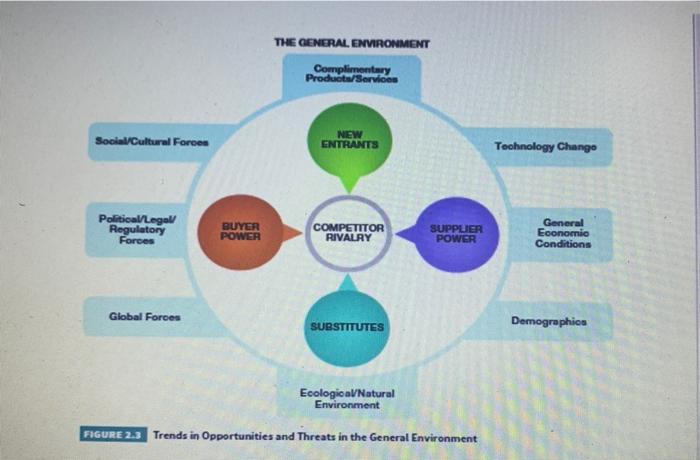
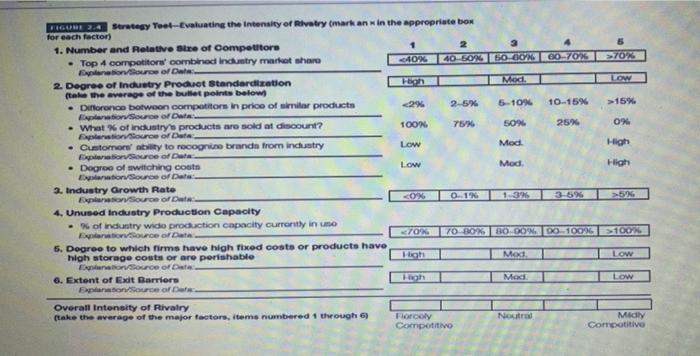
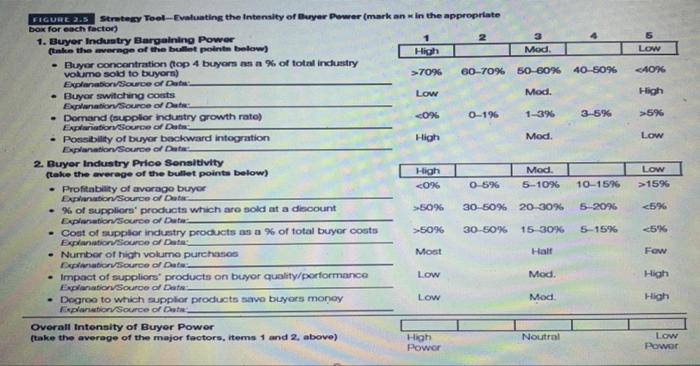
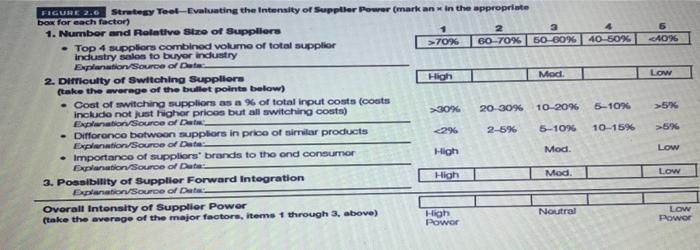
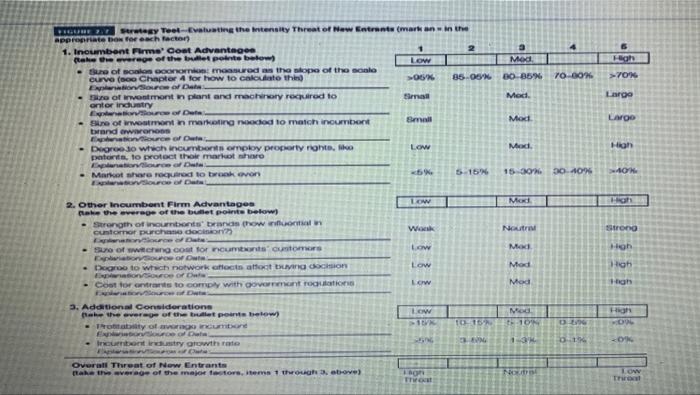
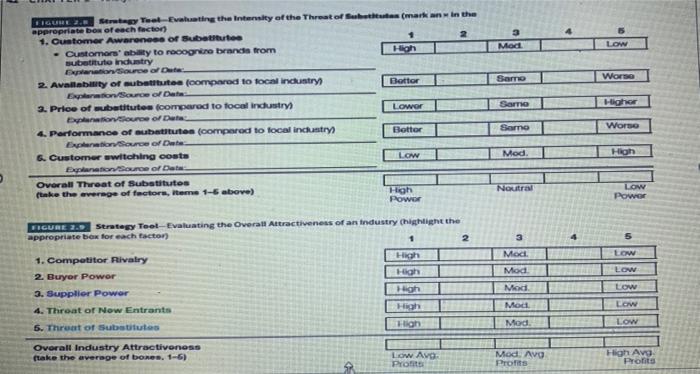
Exercise 2: Practice evaluating the five forces, using the strategy tools presented in this chapter. 1. Use either an industry that your professor assigns to you or pick an industry of your choice. 2. Use a five-forces tool that your professor assigns to you (or one of your choice) to evaluate that force within the industry you are analyzing. Be prepared to either hand in your completed analysis, using the tools from Figures 2.3-2.9, or show and explain it in class Social/Cultural Forces Political/Legal/ Regulatory Forces Global Forces BUYER POWER THE GENERAL ENVIRONMENT Complimentary Products/Services NEW ENTRANTS COMPETITOR RIVALRY SUBSTITUTES SUPPLIER POWER Ecological/Natural Environment FIGURE 2.3 Trends in Opportunities and Threats in the General Environment Technology Change General Economic Conditions Demographics FIGURE 2.4 Strategy Teet-Evaluating the Intensity of Rivalry (mark anx in the appropriate box for each factor) 1. Number and Relative Size of Competitore Top 4 competitors' combined industry market sharo Explanation/Source of Data 2. Degree of Industry Product Standardization (take the average of the bullet points below) Difference betwoon competitors in price of similar products Explanation/Source of Data What % of industry's products are sold at discount? Explanation/Source of Data Customors' ability to recognize brands from industry Explanation/Source of Data Degree of switching costs Explanation/Source of Data 3. Industry Growth Rate Explanation/Source of Data 4. Unused Industry Production Capacity % of industry wide production capacity currently in uso Explanation/Source of Data. 5. Degree to which firms have high fixed costs or products have high storage costs or are perishable Explanation/Source of Data 6. Extent of Exit Barriers Explanation/Source of Data Overall Intensity of Rivalry (take the average of the major factors, items numbered 1 through 6) -40% High 15% 0% High High >5% >100% Low Low Midly Competitive FIGURE 2.5 Strategy Tool-Evaluating the Intensity of Buyer Power (mark an x in the appropriate box for each factor) 1. Buyer Industry Bargaining Power (take the average of the bullet points below) - Buyor concentration (top 4 buyars as a % of total industry volume sold to buyors) Explanation/Source of Data Buyor switching costs Explanation/Source of Data Domand (supplier industry growth rato) Explanation/Source of Data - Possibility of buyor backward integration Explanation/Source of Data 2. Buyer Industry Price Sensitivity (take the average of the bullet points below) . Profitability of avorago buyor Explanation/Source of Data % of suppliers' products which are sold at a discount Explanation/Source of Data . Cost of supplor industry products as a % of total buyor costs Explanation/Source of Data Number of high volumo purchases Explanation/Source of Dat Impact of suppliers' products on buyor quality/porformance Explanation/Source of Data . Dogroo to which supplior products savo buyers money Explanation/Source of Data Overall Intensity of Buyer Power (take the average of the major factors, items 1 and 2, above) High >70% Low -0% High High 50% >50% Most Low Low High Power 2 Mod. 60-70% 50-60% 40-50% Mod. 1-3% 0-1% Mod. 0-5% Mod. 5-10% 10-15% 30-50% 20-30% 5-20% 30-50% 15-30% Half Mod. Mod. 3-5% Noutral 5-15% Low 5% Low Low >15% 70% High >30% 5% >5% Low Low Low Power FIGURE 7.7 Strategy Teet-Evaluating the Intensity Threat of New Entrants (mark an in the appropriate box for each factor) 1. Incumbent Firme' Cost Advantagen (take the everage of the bullet points below) Sure of soalos oconomios: massurod as the slope of the scalo curve (so0 Chapter 4 for how to calculate thin ExplanationSource of Data Size of investmont in plant and machinery required to ontor industry Explanation/Source of Deta Size of investment in marketing noodod to match incumbent brand awaronoss Explanationiource of Data Degree 30 which incumbonts omploy property rights, liko patorts, to protect thoir markot sharo Explanation/ource of Data Markot share required to brook ovon ExplanationSource of Data 2. Other Incumbent Firm Advantages Rake the average of the bullet points below) Strength of incumbonts brands (how influential in customer purchase decision?) Explanatornource of Data So of switching cost for incumbionts customers Explanation Source of Data Degroo to which notwork offocts affoct buying decision Explanation/tource of Das Cost for ontrants to comply with govornmant regulations 3. Additional Considerations (take the average of the bullet points below) Prottablity of avorago incumbone Explanationource of Data Incumbent industry growth rate Expletion of Cate Overall Threat of Now Entrants take the average of the major factors, items 1 through 3, above) Low >95% Small Bmall Low 86% Low Wook Low Low Low Low -15% ING Lagn Throat 2 85-05% 5-15% 10-15% CRAVING 3 Mod 80-85% 70-80% Mod Mod Mod. 15-30% Mod Noutral Mod Mod Mod Mod -10% 1-3% 4 NOUDB 30-40% 13806 3-3% High >70% Largo Large High >40% High Strong High High High High 20% -0% Low Throat FIGURE 2.8 Strategy Teal-Evaluating the Intensity of the Threat of Substitutes (mark an in the appropriate box of each factor) 2 1. Customer Awareness of Substitutos - Customers' ability to recognize brands from substituto industry Explanation Source of Date 2. Availability of substitutes (compared to focal industry) Explanation/Source of Data 3. Price of substitutes (compared to focal industry) Explanation/tource of Data 4. Performance of substitutes (compared to focal industry) Explanation Source of Data 6. Customer switching costs Explanation/Source of Data Overall Threat of Substitutos (take the average of factors, items 1-6 above) 1. Competitor Rivalry 2. Buyer Power 3. Supplier Power 4. Throat of Now Entrants 5. Threat of Substitutes High Overall Industry Attractiveness (take the average of boxes, 1-6) Bottor Lower Bottor Low FIGURE 2.9 Strategy Tool-Evaluating the Overall Attractiveness of an Industry (highlight the appropriate box for each factor) High Power 1 High High High High High Low Avg. Profits 2 Mod Samo Same Samo Mod. Noutral 3 Mod Mod. Mod. Mod Mod. Mod. Avg. Profits Low Worse Highor Worse High LOW Power Low Low Low Low Low High Avg. Profits Step by Step Solution
There are 3 Steps involved in it
1 Expert Approved Answer
Step: 1 Unlock

Question Has Been Solved by an Expert!
Get step-by-step solutions from verified subject matter experts
Step: 2 Unlock
Step: 3 Unlock