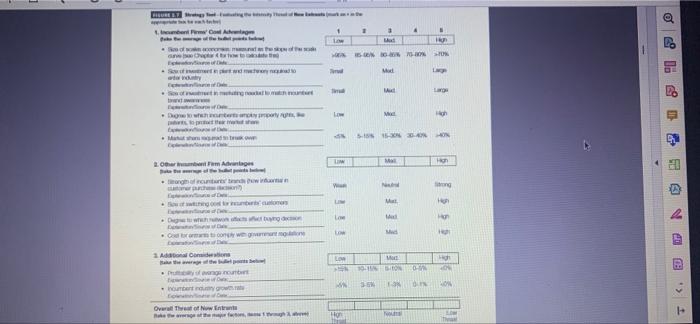
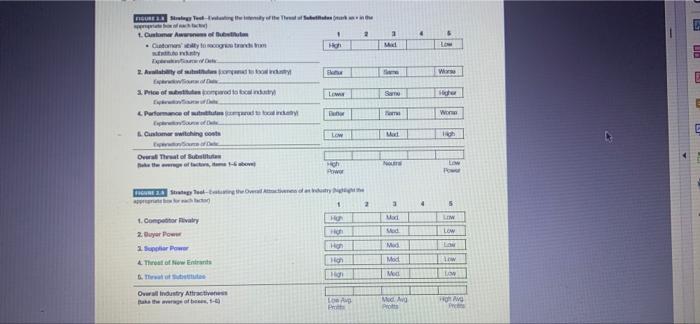
Question: Exercise 2: Practice evaluating the five forces, using the strategy tools presented in this chapter. 1. Use either an industry that your professor assigns to

Exercise 2: Practice evaluating the five forces,
Exercise 2: Practice evaluating the five forces, using the strategy tools presented in this chapter. 1. Use either an industry that your professor assigns to you or pick an industry of your choice. 2. Use a five-forces tool that your professor assigns to you (or one of your choice) to evaluate that force within the industry you are analyzing. Be prepared to either hand in your completed analysis, using the tools from Figures 2.3-2.9, or show and explain it in class Social Cultural Forces Political/Legal Regulatory Forces K Global Forces BUYER POWER THE GENERAL ENVIRONMENT Complimentary Product/Services NEW ENTRANTE COMPETITOR RIVALRY SUBSTITUTES SUPPLIER POWER Ecological/Natural Environment FIGURE 2.3 Trends in Opportunities and Threats in the General Environment Technology Change General Economic Conditions Demographics FIGURE 34 Shogy Teel-Evtg the Inty of dry mark an in the appropriate b 1. Number and dative Size of Competitors Top 4 competiton/ combined indtry Ece of Da 2. Degree of Industry Product Standardization the age of the teet points bek Dance betwoon competitors in price of a products Se of Des What % of indady's products au sodat diecount? Explore of Dis Customan stillty to recognizo brands from industry of D Degree of switching cou Expose of Da 3. Industry Growth Rale Explore of Da & Unused Industry Production Capacity % of industry wide production capacity cununity in use Edonource of Des 5. Degree to which firms have high fixed costs or products have high storage costs or are perishablo ExplanadonSource of Cate & Extent of Exit Barriers Expletion/Source of Da Overall Intensity of Rivalry Cake the average of the major factors, items numbered 1 through 2 40% 40-50% 50-60% 60-70% -22% 100% LOW Low 60% High High 2-5% 5-10% 10-15% 75% 25% 0-1% Mad Forcoly Competitive 50% Mod Mad Mad Mad 6 $70% 15% 0% High High 3-5% 56/% Low Low Midy Competitive CHAPTER 2 Analysis of the External Eviment Opportunities and Theats FIGURE 2.3 Megy Tool-Eating the intermity of Buyer Power in the appropri boe for each facto 1. Buyer Industry Bargaining Power Be the of the buet points Buyer concentration Bop 4 buyors as a % of total industry volume sold to buy ExplanationSource of Duts Bayar switching costs Expon/Source of D Domand upplor excustry growth ra Expo/Source of Da Possibility of buyer backward integration ExploSource of Des 2. Buyer Industry Price Sensitivity Bake the average of the bullet points below) Profitability of average buyer Explanadon/Soune of Des % of supplions products which are sold at a discount ExplanationSource of Dut Cost of supplier industry products as a % of total buyor costs Explanation/Source of Dat Number of high volume purchases Explanation Source of Des impact of supplion products on buyer quality performance Explanation Source of Des Degree to which supplier products save buyers money Explanation Source of De Overall Intensity of Buyer Power take the average of the major factors, items 1 and 2, above) 1 High >70% Low -0% High Low Low 2 High Mad Low 80-70% 50-60% 40-50% 40% 0-1% Mad 1-3% Mod High Mad 50% 30-50% 20-30% 5-20% >50% 30-50% 15-30% 5-15% Most Half 4 Mod. Mod. Noutral 3-5% >5% Low Low >15% di% 70% High >30% High 5% >5% Low Low Low Powor R 1.7 g - they of s Eple Soft any Exe Sofing nude manut w Dign to which tersangk poprothes Matat show C 2.0 Fem dage of the posts b ngh of incuntures tnc powin c) d Sow of wing od to be cons of D Due to which two facts abung den D Como comply with gementione Dosto 3 Adonal Considerations Pruty of evange incumbit of D numbent grow Conne Overall Threat of Now the of the major factors, 1 gha Low J Low W LIM Loe Low Low Hon 1 ME Mad 100% 30-40% 70-30% Mod Mud Mod 5-15% 15-330-47% Mal Na Mat Mad A Mad NORT B H STOK Lage Large High 40% Mad 10-11 N 20-% AN 3-6% 1-3% OLIN HOW High Song High Ha High O Thea o 15 68 11 & 63 V All 08 <. figure stegy test-eating the intendy of thest sabetta customer awareness bubet customers to constant story de availability its toon exp d price but compared focal industry performance status parodo switching costs overal threat sub fact t competitor rivalry buyer power supplar throat new entrants thewal substitutes high overall attractiveness ak average el low banor strategy teal-eating ativne a nutrygghe approac higi av prots mid samu m mad no med. mod mea med avg protts wars higher won pres e>

Step by Step Solution

There are 3 Steps involved in it

1 Expert Approved Answer
Step: 1 Unlock blur-text-image
Question Has Been Solved by an Expert!

Get step-by-step solutions from verified subject matter experts

Step: 2 Unlock
Step: 3 Unlock

Students Have Also Explored These Related General Management Questions!