

Question: Using graphing software (excel, sheets, numbers, etc.) create a graph of the following data points and determine the linear R-squared (R2) value. Measurement1234Xvalue0.982.273.204.29Yvalue19.55548.21369.28191.064
Using graphing software (excel, sheets, numbers, etc.) create a graph of the following data points and determine the linear R-squared (R2) value.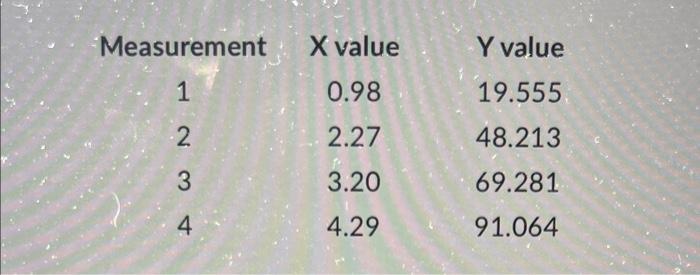
Measurement1234Xvalue0.982.273.204.29Yvalue19.55548.21369.28191.064
Step by Step Solution
There are 3 Steps involved in it
1 Expert Approved Answer
Step: 1 Unlock

Question Has Been Solved by an Expert!
Get step-by-step solutions from verified subject matter experts
Step: 2 Unlock
Step: 3 Unlock