

Question: Using lab 7 with a two-day lead time (all original values), what is the total cost if we increase the min and max by 10%
-
Using lab 7 with a two-day lead time (all original values), what is the total cost if we increase the min and max by 10% each?
A. $475,194
B. $516,480
C. $253,671
D. $245,801
10 points
QUESTION 2
-
Using lab 7 with a two-day lead time (all original values), what amount will be ordered on day 95, assuming a min of 3,000 and a max of 5,100?
A. 2,769
B. 2,711
C. 0
D. 2,990
E. 2,389
10 points
QUESTION 3
-
Using lab 7 with a two-day lead time (all original values), what is the total holding cost assuming that a min and max of 2,900 and 4,400, respectively, are used?
A. $95,613
B. $123,400
C. $244,047
D. $115,083
10 points
QUESTION 4
-
Using lab 7 with a two-day lead time (all original values), what is the optimal min and max to get the lowest total cost, rounded to the nearest increment of 50?
A. Min = 2,800
Max = 4,200
B. Min = 2,750
Max = 4,150
C. Min = 2,800
Max = 4,150
D. Min = 2,750
Max = 4,200
10 points
QUESTION 5
-
Using lab 7 with a three-day lead time (all original values), what is the total cost with a min and max of 7,700 and 9,900, respectively? (Round your answer to the nearest whole number)
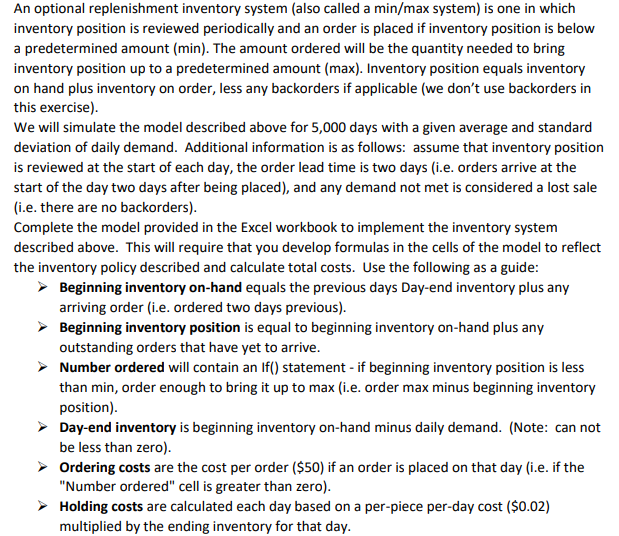
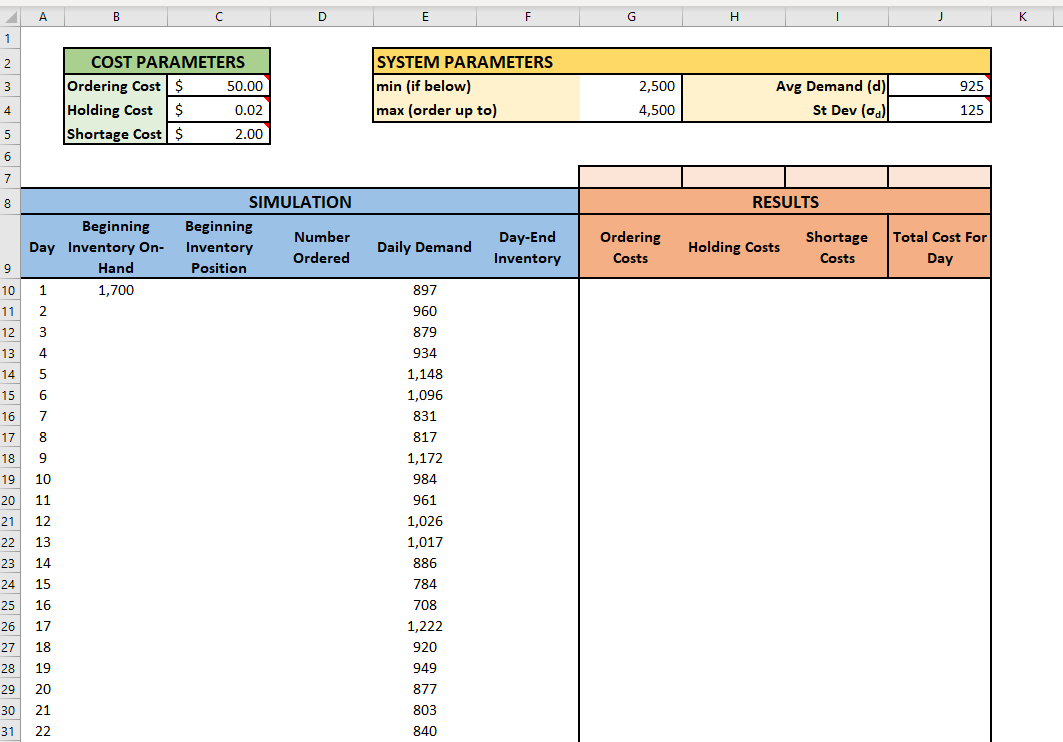
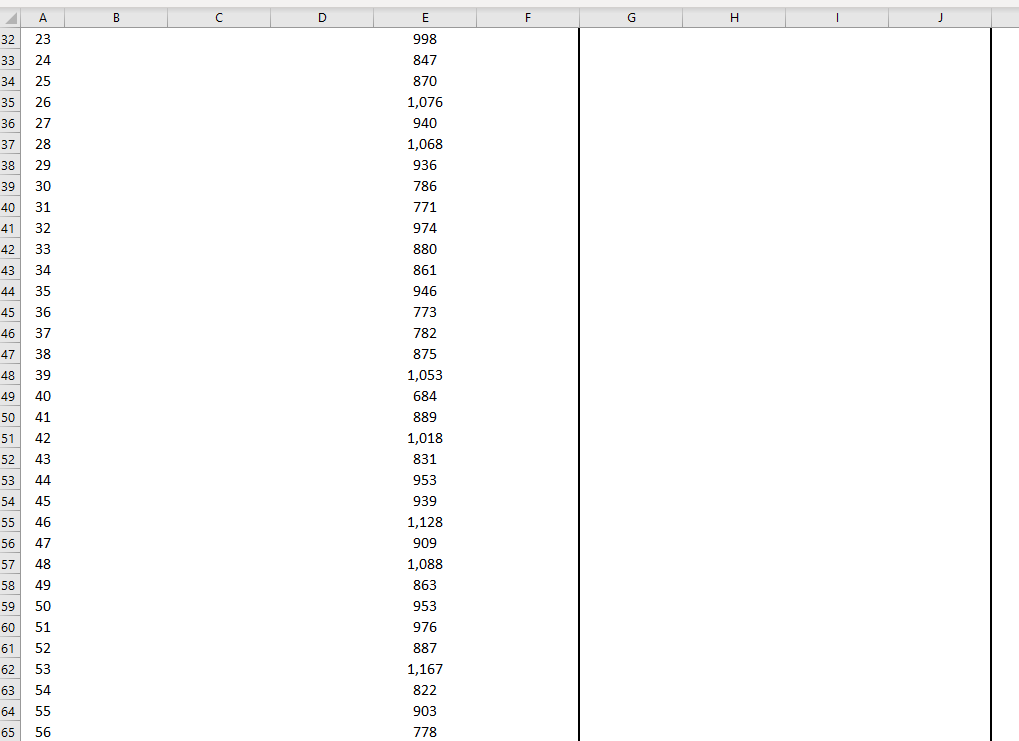
An optional replenishment inventory system (also called a min/max system) is one in which inventory position is reviewed periodically and an order is placed if inventory position is below a predetermined amount (min). The amount ordered will be the quantity needed to bring inventory position up to a predetermined amount (max). Inventory position equals inventory on hand plus inventory on order, less any backorders if applicable (we don't use backorders in this exercise). We will simulate the model described above for 5,000 days with a given average and standard deviation of daily demand. Additional information is as follows: assume that inventory position is reviewed at the start of each day, the order lead time is two days (i.e. orders arrive at the start of the day two days after being placed), and any demand not met is considered a lost sale (i.e. there are no backorders). Complete the model provided in the Excel workbook to implement the inventory system described above. This will require that you develop formulas in the cells of the model to reflect the inventory policy described and calculate total costs. Use the following as a guide: Beginning inventory on-hand equals the previous days Day-end inventory plus any arriving order (i.e. ordered two days previous). Beginning inventory position is equal to beginning inventory on-hand plus any outstanding orders that have yet to arrive. Number ordered will contain an if() statement - if beginning inventory position is less than min, order enough to bring it up to max (i.e. order max minus beginning inventory position) Day-end inventory is beginning inventory on-hand minus daily demand. (Note: can not be less than zero). Ordering costs are the cost per order ($50) if an order is placed on that day (i.e. if the "Number ordered" cell is greater than zero). Holding costs are calculated each day based on a per-piece per-day cost ($0.02) multiplied by the ending inventory for that day. Shortage costs are the shortage cost per unit ($2.00) multiplied by the amount short (i.e. if Demand > beginning on-hand). All formulas should reference cells of relevant parameters. Use of the Max() and if() functions are recommended. *You may find is useful to complete the first few rows, based on predetermined demand, to confirm that you have the following when you set min = 2,500 and max = 4,500. 2 3 COST PARAMETERS Ordering Costs 50.00 Holding Cost $ 0.02 Shortage Costs 2.00 SYSTEM PARAMETERS min (if below) max (order up to) 2,500 4,500 Avg Demand (d) St Dev (0.) 925 125 4 5 6 7 $ 84,750 $ 347,316S 527,679 95,613 $ RESULTS Daily Demand Ordering Costs Holding Costs Shortage Costs Total Cost For Day 897 803 960 $ $ Beginning Day Inventory On- 9 Hand 10 1 1,700 11 2 12 3 2,800 13 4 1,921 14 5 987 15 6 2,579 16 7 1,483 17 8 652 18 9 3,017 19 10 1,845 SIMULATION Beginning Number Inventory Ordered Position 1,700 2,800 3,603 0 2,800 0 1,921 2,579 3,566 0 2,579 0 1,483 3,017 3,669 0 3,017 0 1,845 2,655 879 934 1,148 1,096 831 817 1,172 984 Day-End Inventory 803 0 1,921 987 0 1,483 652 0 1,845 861 50.00 S $ $ 50.00 $ $ $ 50.00 $ $ S 50.00 $ 16.06 $ $ 38.42 $ 19.74 5 $ 29.66 $ 13.04 S S 36.90 $ 17.22 $ 314.00 S $ $ 322.00 $ $ $ 330.00 $ $ S 66.06 314.00 38.42 69.74 322.00 29.66 63.04 330.00 36.90 67.22 What do you think will happen to total ordering, holding and shortage costs as min and max are changed? For each of the following, make a hypothesis before using the simulation to test. 1. If min remains at 2,500 while max is increased, a. Total ordering costs will (increase/decrease) b. Total holding costs will (increase/decrease) C. Total shortage costs will (increase/decrease) d. Test your hypothesis by leaving min=2,500 and changing max to 5,000. Were your correct? Try, in your own words, to explain the reasons. 2. Set max to 4,500 again. What do you think will happen if max remains at 4,500 while min is increased? a. Total ordering costs will (increase/decrease) b. Total holding costs will (increase/decrease) C. Total shortage costs will (increase/decrease) d. Test your hypothesis by leaving max=4,500 and changing min to 3,000. Were 3. your correct? Experiment with different values of min and max and see how low you can get total costs. (Hint - Try to get total costs down to about $230,000). [Time permitting). Make a copy of your model worksheet. Modify the model to reflect a three (rather than two) day lead time. 4. A B D E F G H K 1 2 3 SYSTEM PARAMETERS min (if below) max (order up to) 2,500 COST PARAMETERS Ordering Cost $ 50.00 Holding Cost $ 0.02 Shortage Cost $ 2.00 925 Avg Demand (d) ( 4 4,500 ) st Dev 125 5 6 7 8 RESULTS SIMULATION Beginning Number Inventory Ordered Position Daily Demand Beginning Day Inventory On- Hand 1 1,700 Day-End Inventory Ordering Costs Holding Costs Shortage Costs Total Cost For Day 9 10 11 2 3 12 13 14 4 5 15 16 17 6 7 8 18 19 20 21 9 10 11 12 13 897 960 879 934 1,148 1,096 831 817 1,172 984 961 1,026 1,017 886 784 708 1,222 920 949 877 803 840 22 14 23 24 25 15 16 26 27 17 18 19 28 29 20 30 31 21 22 I 998 847 870 1,076 940 1,068 936 786 771 974 880 861 946 773 782 875 1,053 684 889 1,018 831 953 939 1.128 909 1,088 863 953 976 887 1,167 822 903 778
Step by Step Solution
There are 3 Steps involved in it

Get step-by-step solutions from verified subject matter experts