

Question: Using Matlab Assignment 1. In the command window enter help plot. Plot the following function: PAGE 8 y = sin(2) Where x goes from 0
Using Matlab
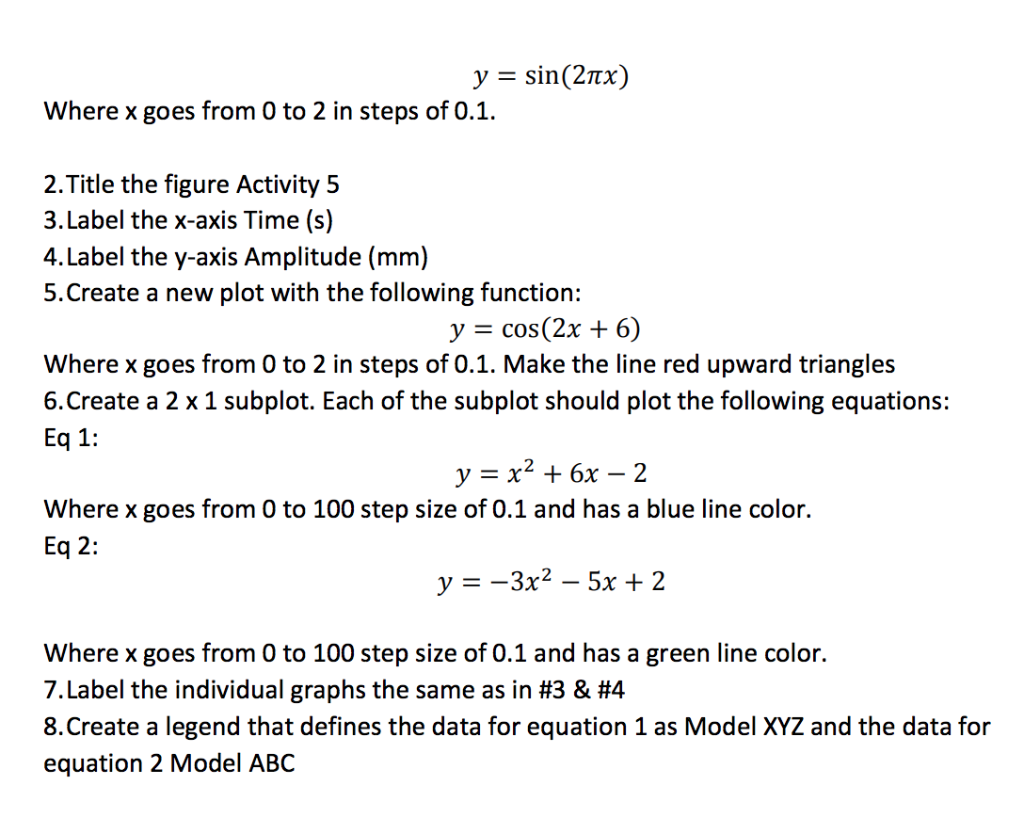
Assignment 1. In the command window enter help plot. Plot the following function: PAGE 8 y = sin(2) Where x goes from 0 to 2 in steps of 0.1. 2.Title the figure Activity 5 3.Label the x-axis Time (s) 4.Label the y-axis Amplitude (mm) 5.Create a new plot with the following function: y = cos(2x + 6) Where x goes from 0 to 2 in steps of 0.1. Make the line red upward triangles 6.Create a 2 x 1 subplot. Each of the subplot should plot the following equations: Eq 1: y=x2 +6x-2 Where x goes from 0 to 100 step size of 0.1 and has a blue line color. Eq 2: y-3x2- 5x 2 Where x goes from O to 100 step size of 0.1 and has a green line color. 7. Label the individual graphs the same as in #3 & #4 8.Create a legend that defines the data for equation 1 as Model XYZ and the data for equation 2 Model ABC
Step by Step Solution
There are 3 Steps involved in it

Get step-by-step solutions from verified subject matter experts