

Question: using matlab Assignment 1 A discrete-time signal is shown in Figure P1. Sketch and label carefully each of the following signals: a) x[n-4) b) x[3-n]
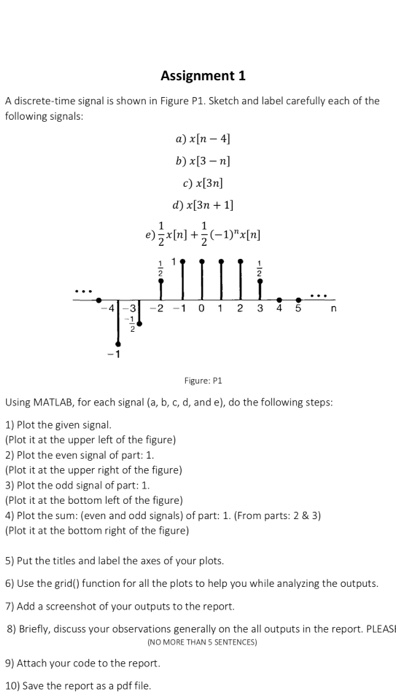
Assignment 1 A discrete-time signal is shown in Figure P1. Sketch and label carefully each of the following signals: a) x[n-4) b) x[3-n] c) x[31] d) x[3n + 1] e){x{n}+{(-1)"x[n] -41-3 -2 -1 0 1 2 3 4 5 n Figure: P1 Using MATLAB, for each signal (a, b, c, d, and e), do the following steps: 1) Plot the given signal. (Plot it at the upper left of the figure) 2) Plot the even signal of part: 1. (Plot it at the upper right of the figure) 3) Plot the odd signal of part: 1. (Plot it at the bottom left of the figure) 4) Plot the sum: (even and odd signals) of part: 1. (From parts: 2 & 3) (Plot it at the bottom right of the figure) 5) Put the titles and label the axes of your plots. 6) Use the grid() function for all the plots to help you while analyzing the outputs. 7) Add a screenshot of your outputs to the report. 8) Briefly, discuss your observations generally on the all outputs in the report. PLEASE NO MORE THAN 5 SENTENCES) 9) Attach your code to the report. 10) Save the report as a pdf file
Step by Step Solution
There are 3 Steps involved in it

Get step-by-step solutions from verified subject matter experts