

Question: Using Matlab, construct and plot the signal x (t) below for the range of -5
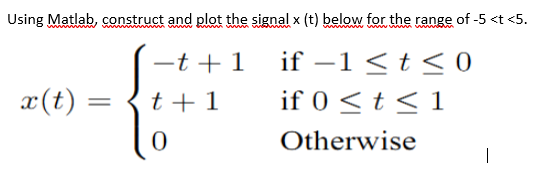
Using Matlab, construct and plot the signal x (t) below for the range of -5
Step by Step Solution
There are 3 Steps involved in it
1 Expert Approved Answer
Step: 1 Unlock

Question Has Been Solved by an Expert!
Get step-by-step solutions from verified subject matter experts
Step: 2 Unlock
Step: 3 Unlock